
How to trade Bollinger Bands?
Bollinger Bands stand as one of the foremost technical analysis tools in contemporary trading. This article aims to explore in-depth the intricate workings behind the specific parameters that drive this indicator, alongside examining various strategies that traders commonly employ.
What are Bollinger Bands?
True to their name, Bollinger Bands display price lines on a chart, illustrating the channel or range of volatility within which the price of a particular financial instrument fluctuates.
Bollinger Bands consist of three key elements:

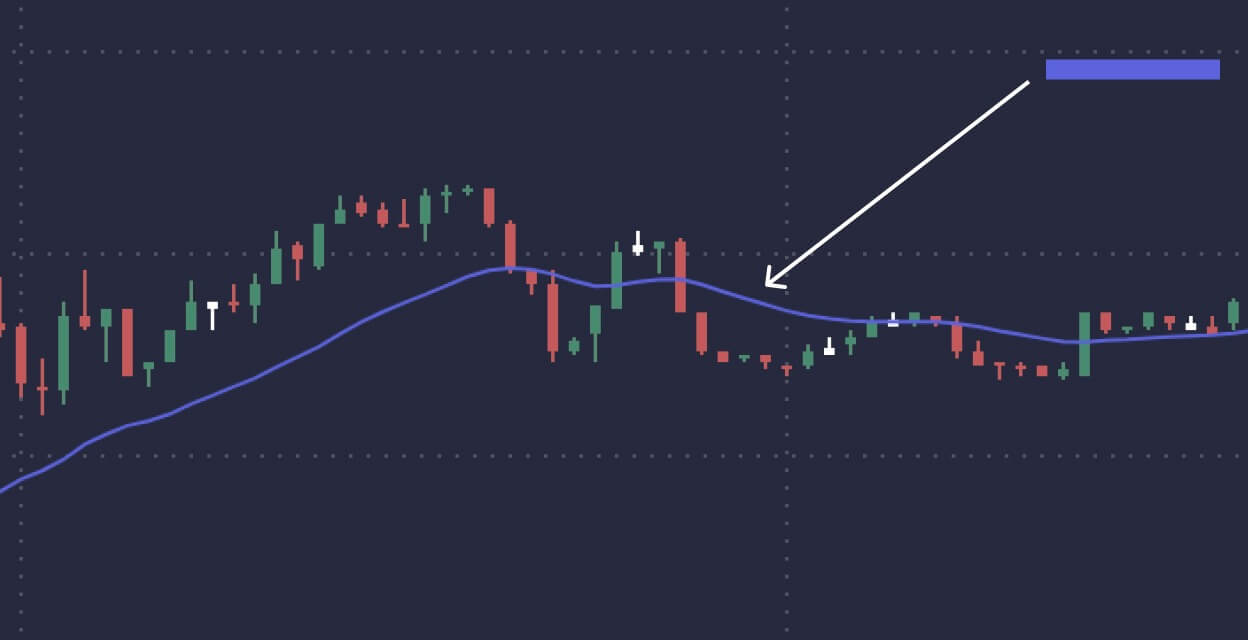
1. Middle Band: This is a 20-period simple moving average (MA).
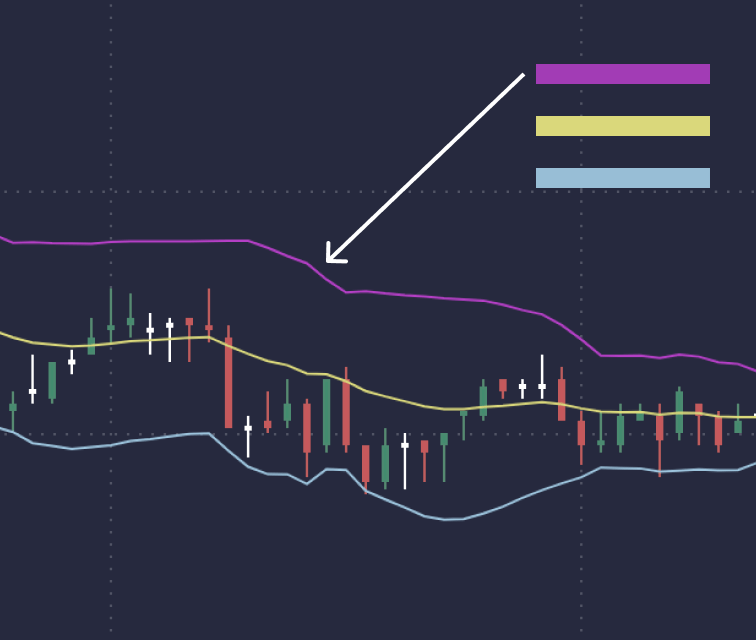
2. Upper band: located above the middle band by a certain number of standard deviations of price.
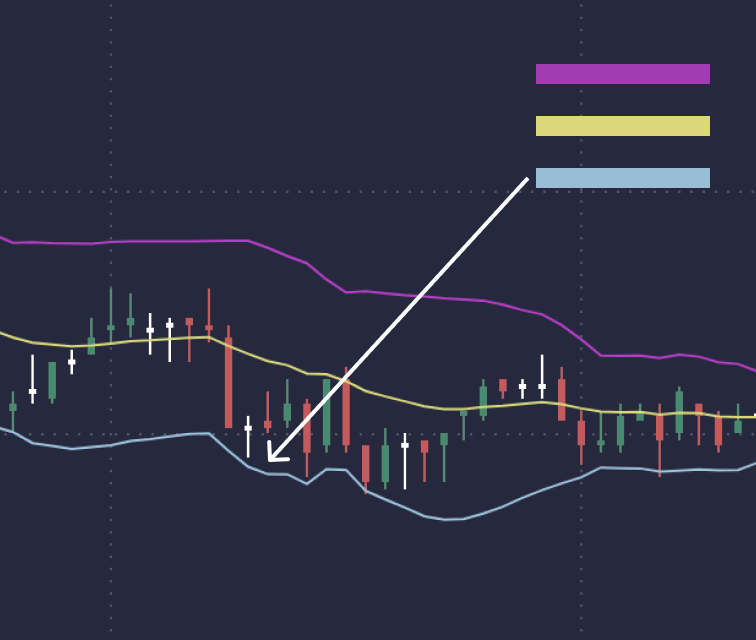
3. Lower range: located below the average range by a certain number of standard deviations of price.
When using Bollinger Bands, traders have the flexibility to choose two options:
1. The period used in the moving average, which can be five minutes, an hour or a day.
2. Standard deviation (StdDev). This parameter serves as a statistical indicator of market volatility, indicating the degree to which prices deviate from the average. Although the default StdDev value is 2, it can be adjusted to suit individual trading approaches.


Using Bollinger Bands (BB) in Trading
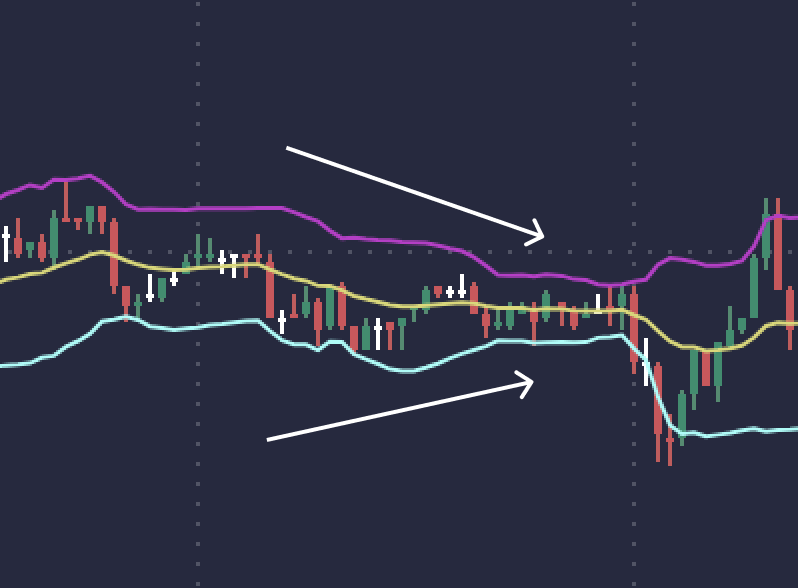
Contraction or expansion of the upper and lower bands reflects changes in price volatility. A contraction indicates a period of low volatility, while an expansion indicates increased market volatility or price dynamics. When the bands move almost parallel to each other for a long time, prices tend to fluctuate between them, forming something like a channel with stable boundaries. The bands defined by the standard deviation also indicate potential support and resistance levels.
The core concept behind the Bollinger Bands trading strategy revolves around assessing an asset’s position in relation to the bands to gauge whether its price is comparatively high or low. Regular interactions with the upper band signal a potential overbought situation, suggesting that the asset may be priced higher than its typical range. Conversely, consistent contact with the lower band points to an oversold condition, implying that the asset could be undervalued.
Trading Strategies Using Bollinger Bands
Approaches to trading using BB vary depending on individual trading styles and goals. Here are several methods that can be used when working with the BB indicator:
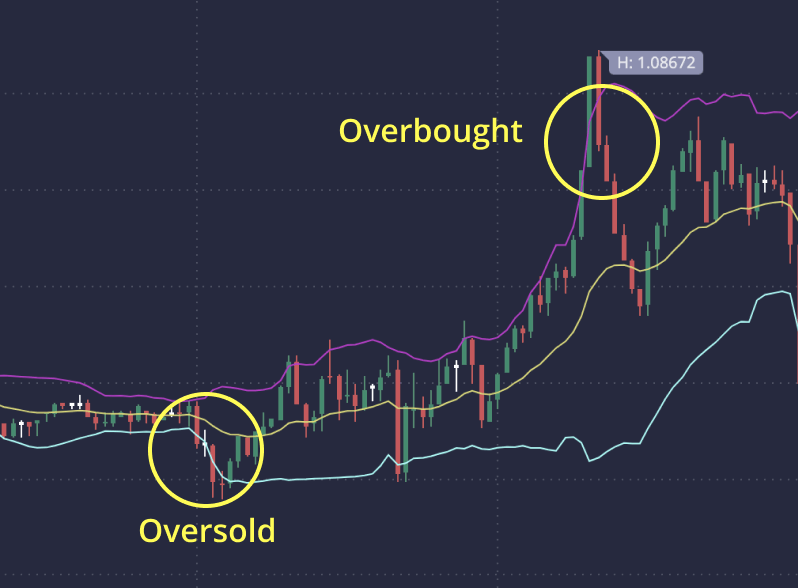
OVERBOUGHT AND OVERSOLD STRATEGY
This approach to trading relies on the concept of changing the average price. The basic principle behind the concept of mean reversal is that if price deviates significantly from it, it will eventually return to its mean.
Using Bollinger Bands, which pinpoint asset prices that deviate from the average, traders relying on this strategy watch when the price of an asset falls below the lower end of the range. In such cases, they may choose to go long, waiting for the price to return to the middle band. Conversely, when the price breaks the upper band, followers of this strategy can open a short position, counting on a return to the middle band.
COMPRESSION STRATEGY
Another technique, known as the Bollinger Bands compression strategy, focuses on periods of narrowing trading ranges that indicate an imminent channel breakout.
This scenario develops when price, after an aggressive move, suddenly enters a severe consolidation phase. Traders can visually distinguish consolidation when the lower and upper bands on the chart converge, indicating a decrease in the volatility of the asset.
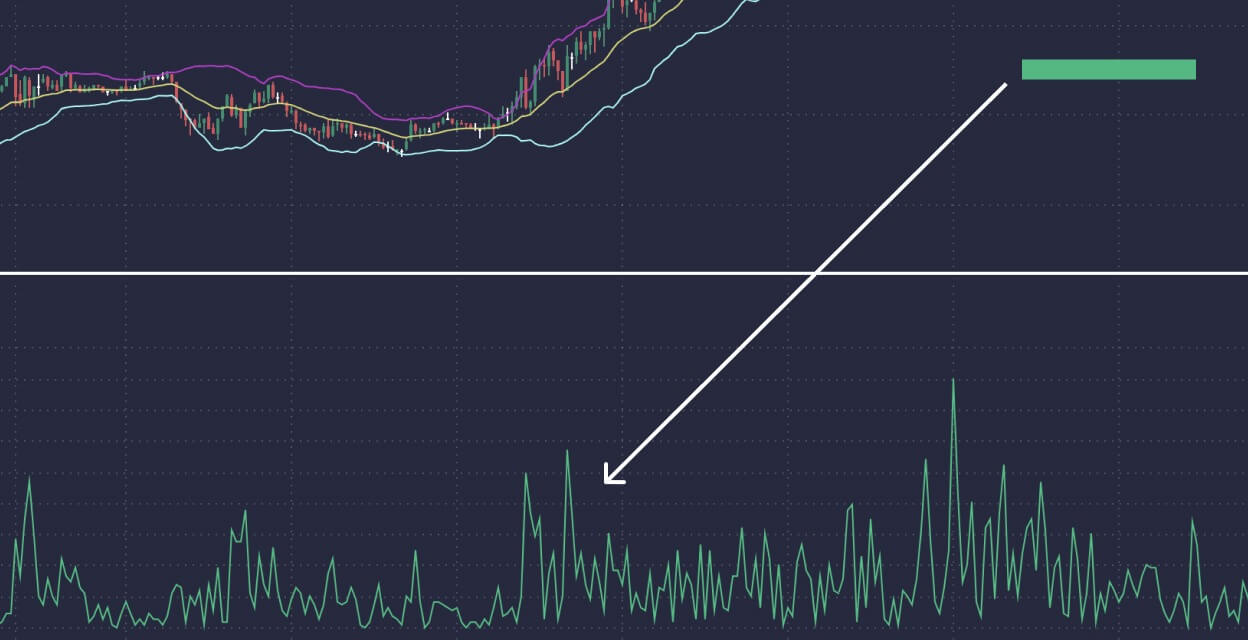
After a period of consolidation, prices tend to undergo a significant movement in one direction, ideally accompanied by an increase in trading volume. However, it is important to note that this observation is based solely on past performance and does not guarantee future returns in every similar case.
An increase in volume during a breakout signals traders that the price will continue to move in a certain direction. When the price breaks the lower or upper limit of the range, traders can choose to sell or buy the asset accordingly. To reduce risk, a stop loss order is usually placed outside the consolidation zone, opposite the direction of the breakout.
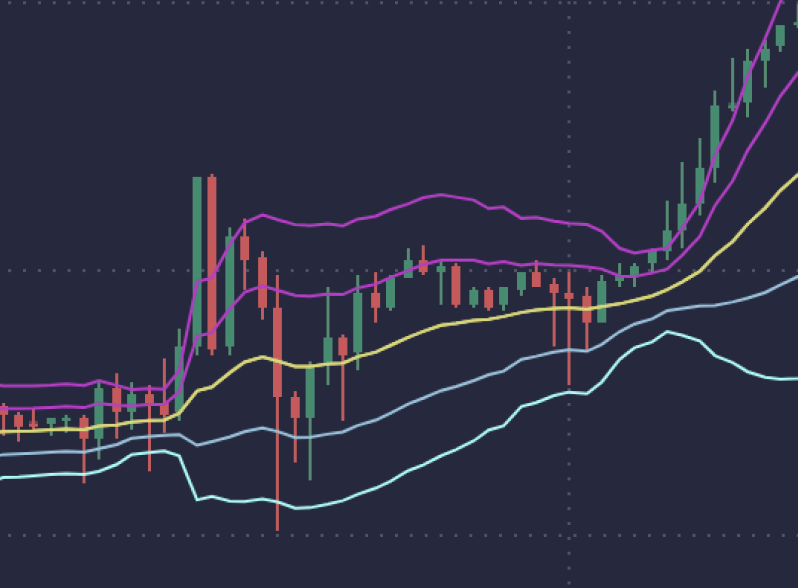
DOUBLE BOLLINGER BANDS (DBB) STRATEGY
Traders using this Bollinger Bands strategy use two sets of price channels when analyzing charts. The first set uses the default parameters: a 20-period interval and two standard deviations (BB2 or outer BB). The second set supports a 20-period interval but uses only one standard deviation (BB1, or inner BB).
The area between the upper boundaries of BB1 and BB2 serves as a buy zone, while the area between the lower boundaries of BB1 and BB2 is designated as a sell zone. The area between the upper and lower boundaries of BB1 is the neutral zone.
Traders using DBB can choose to trade breakouts or stick with the prevailing trend. They look for significant movements in the buy or sell zone and enter long or short positions accordingly.


Conclusions
Bollinger Bands are a valuable technical tool in a trader’s arsenal to provide insight into the range of an asset’s price volatility by placing price channels on a chart.
BB, which include the middle, upper and lower, are defined by the period and standard deviation, which are usually set by default at 20 periods with a standard deviation of 2.
The fundamental premise of using Bollinger Bands is to evaluate price in the context of the bands, allowing traders to determine whether the price is relatively high or low.
There are various Bollinger Band trading strategies, including the overbought and oversold method, the squeeze strategy, and the Double Bollinger Bands (DBB) method.
Each strategy provides unique insight into market dynamics, allowing traders to benefit from price movements within the volatility range outlined by Bollinger Bands.
Essentially, Bollinger Bands offer a comprehensive approach to understanding market dynamics, covering volatility, potential price extremes and trend detection. With customizable options including SMA setting and standard deviation adjustment for ranges, traders can tailor the indicator to a variety of assets and trading strategies, making it a versatile tool in the technical analyst’s arsenal.
FAQ
The standard settings for Bollinger Bands include a 20-day moving average for the middle band, with the upper and lower bands set 2 standard deviations from the middle band. However, these settings can be adjusted depending on the analysis period, asset and trader’s goals.
Bollinger Bands may indicate a potential price breakout through a Bollinger Squeeze. This is when the bands move closer together, indicating a decrease in volatility. Subsequent widening of the bands may signal the start of a new trend as volatility increases.
Bollinger Bands are versatile and can be used in a variety of markets, including stocks, forex and commodities. However, their effectiveness may vary depending on market conditions and should be used in conjunction with other analysis tools for best results.
When used with other technical indicators such as the MACD or Stochastic Oscillator, Bollinger Bands can provide greater insight into market conditions. For example, a trader might expect the stock price to be on the lower Bollinger Band and the MACD to show positive divergence as a potential buy signal.