Exploring the Operation of the Stochastic Oscillator Strategy
Delve into the intricate realm of the stochastic oscillator, a cornerstone of momentum analysis revered in financial circles for its ability to decipher market dynamics. This indispensable tool scrutinizes an asset’s closing price vis-à-vis its price range across a predefined timeframe, typically spanning a fortnight. Such scrutiny unveils the precarious balance between overbought and oversold conditions, providing traders with invaluable cues for anticipating potential market reversals.
Unraveling the Nuances
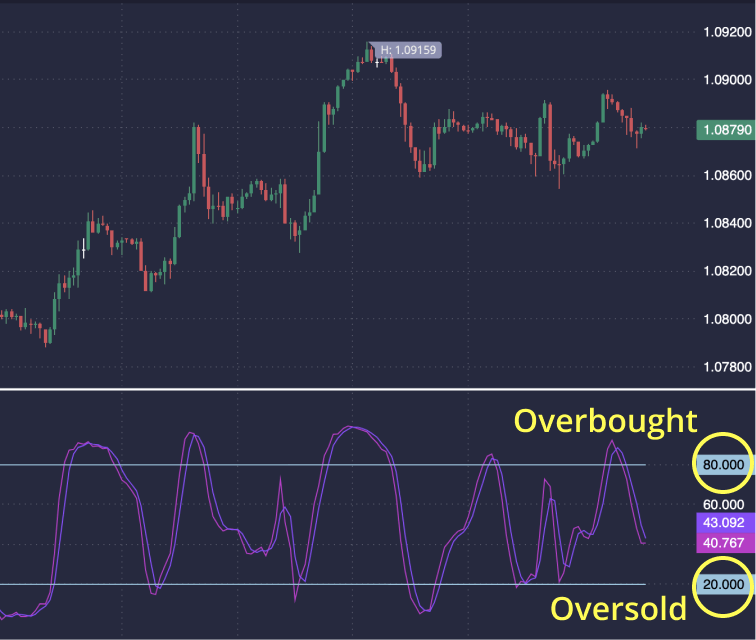
The stochastic oscillator’s prowess lies in its adeptness at flagging overbought and oversold territories, essential for crafting astute buy and sell signals. Its adaptability across diverse timeframes, from fleeting minutes to protracted months, underscores its versatility. At its core, this indicator hinges on the fundamental principle of price action during market upswings and downturns, where prices tend to close near the zenith in uptrends and the nadir in downtrends.
Illuminating Key Features
As a barometer of market momentum, the stochastic oscillator assumes a pivotal role in identifying prospective inflection points in asset valuations. Anchored by its formula, represented as
%K = 100 (C - L14) / (H14 - L14)
Wherein % K symbolizes the asset’s current market rate, C denotes the latest closing price, L14 signifies the lowest price point over the preceding 14 trading days, and H14 denotes the pinnacle of the same period.
This holistic formula empowers traders with a precise gauge of market momentum.
Synergies with Technical Analysis
The stochastic oscillator seamlessly integrates with an array of technical analysis tools, including moving averages, Fibonacci retracements, and candlestick patterns. Through this harmonious fusion, traders gain enhanced discernment regarding an asset’s overbought or oversold status, thereby fine-tuning their trading strategies with surgical precision.
Navigating Implementation
Implementing the stochastic oscillator strategy entails the application of its formula,
%K = 100 (C – L14) / (H14 – L14), wherein traders meticulously monitor %D, the three-day moving average of %K. This supplementary metric furnishes traders with additional insights into market trends, thereby enriching their decision-making process.
In summation, the stochastic oscillator emerges as an indispensable ally in the trader’s toolkit, furnishing invaluable insights into market momentum and potential turning points. Armed with a deep understanding of its mechanics and adept integration into comprehensive trading strategies, traders can chart a course towards informed decision-making, thereby augmenting their prospects for success in the dynamic arena of financial markets.
Strategies for Maximizing the Stochastic Oscillator's Potential
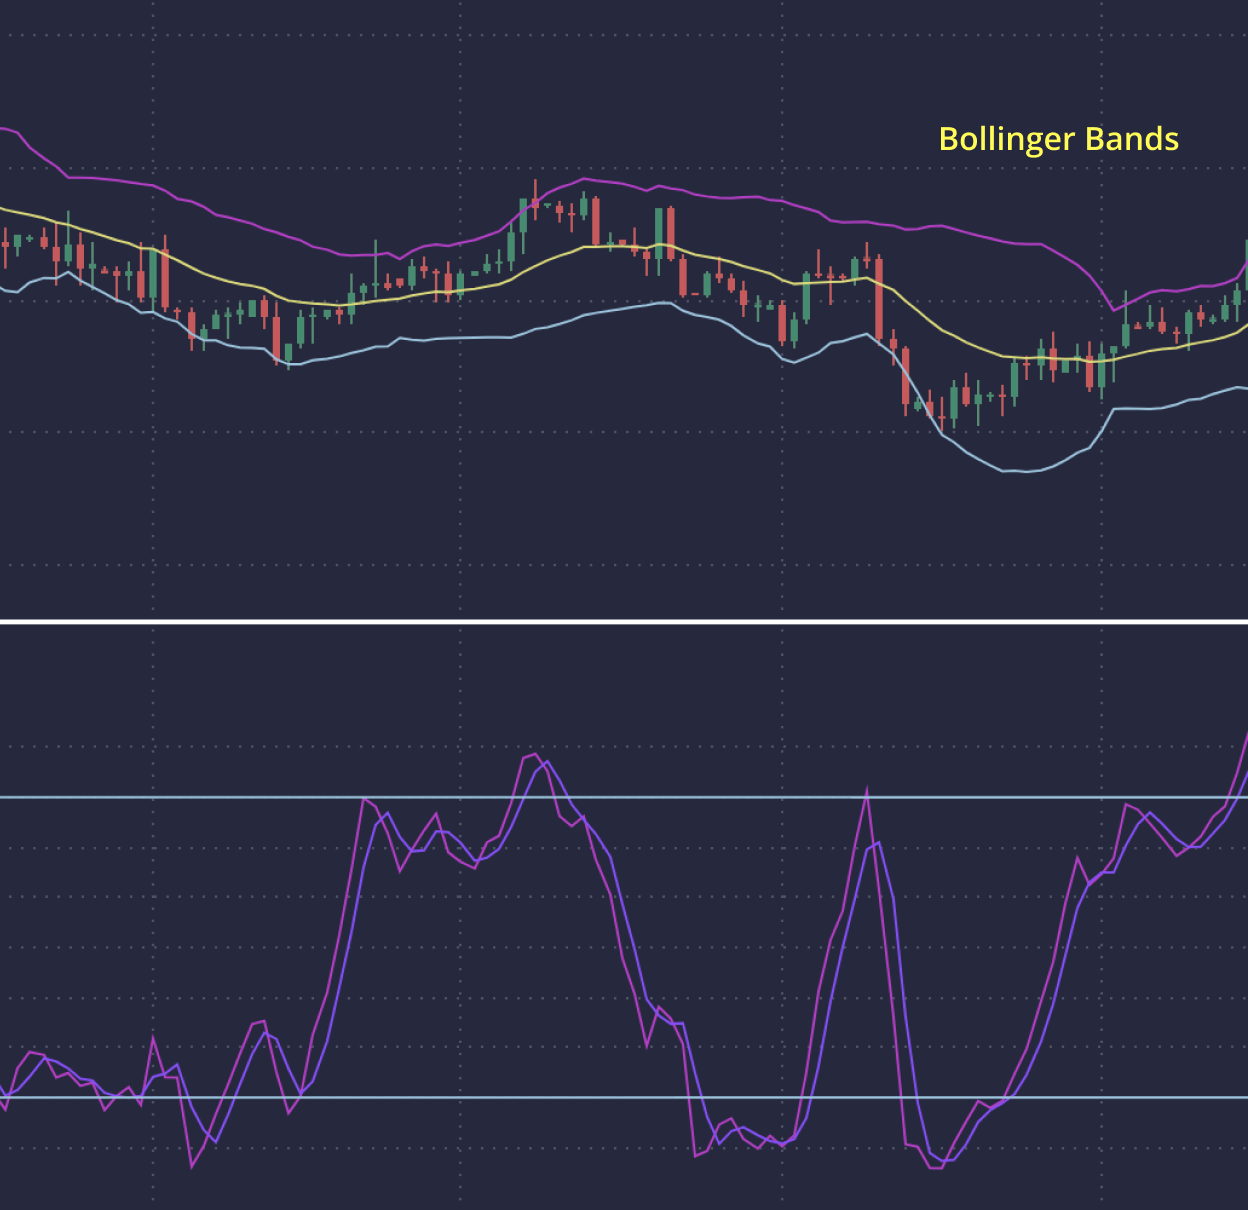
1. Integrating Moving Averages.
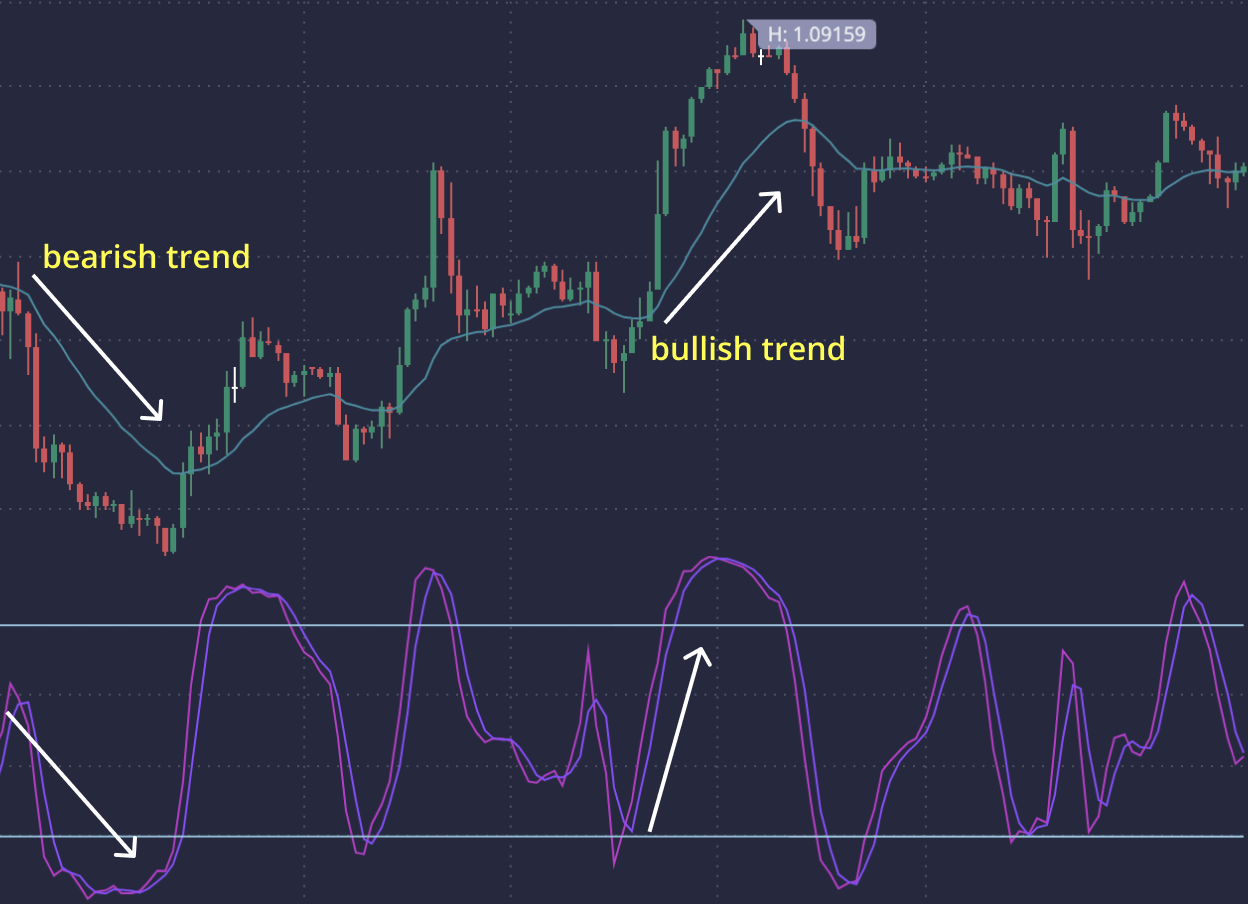
Traders fuse the stochastic oscillator with moving averages (MAs) to fortify their trading strategies. In scenarios like stock trading through contracts for difference (CFDs), MAs discern trends. Should MAs signal a bullish trend, validation from the stochastic oscillator bolsters trading convictions. Conversely, amidst bearish indications from MAs, the stochastic oscillator corroborates potential downward trajectories.
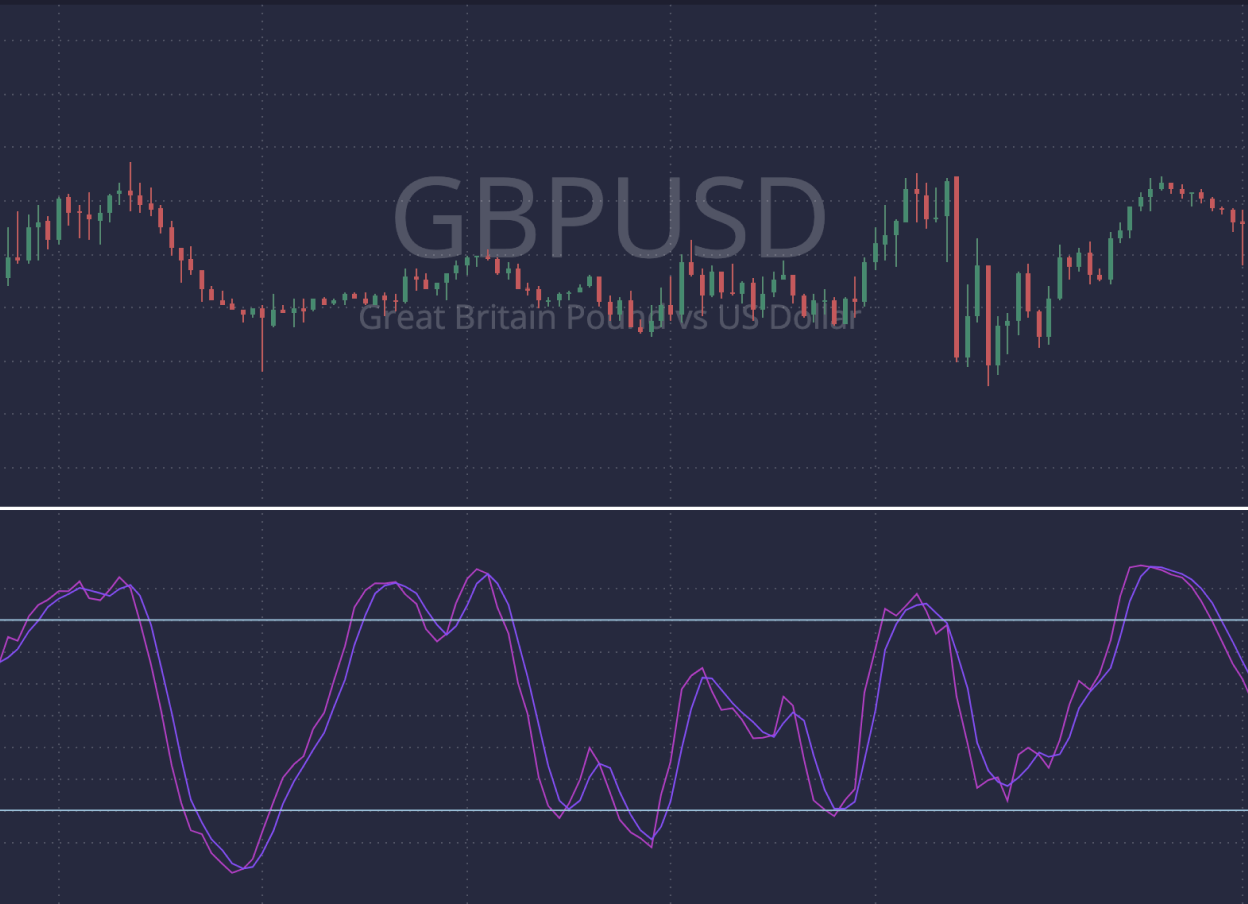
2. Harnessing the Stochastic Oscillator in Currency Trading.
Within the realm of currency pairs like GBP/USD, the stochastic oscillator acts as a compass, steering traders towards potential reversals or trend continuations. Traders await signals of overbought or oversold conditions from the stochastic oscillator before initiating trades, thereby refining the precision of their trading decisions.
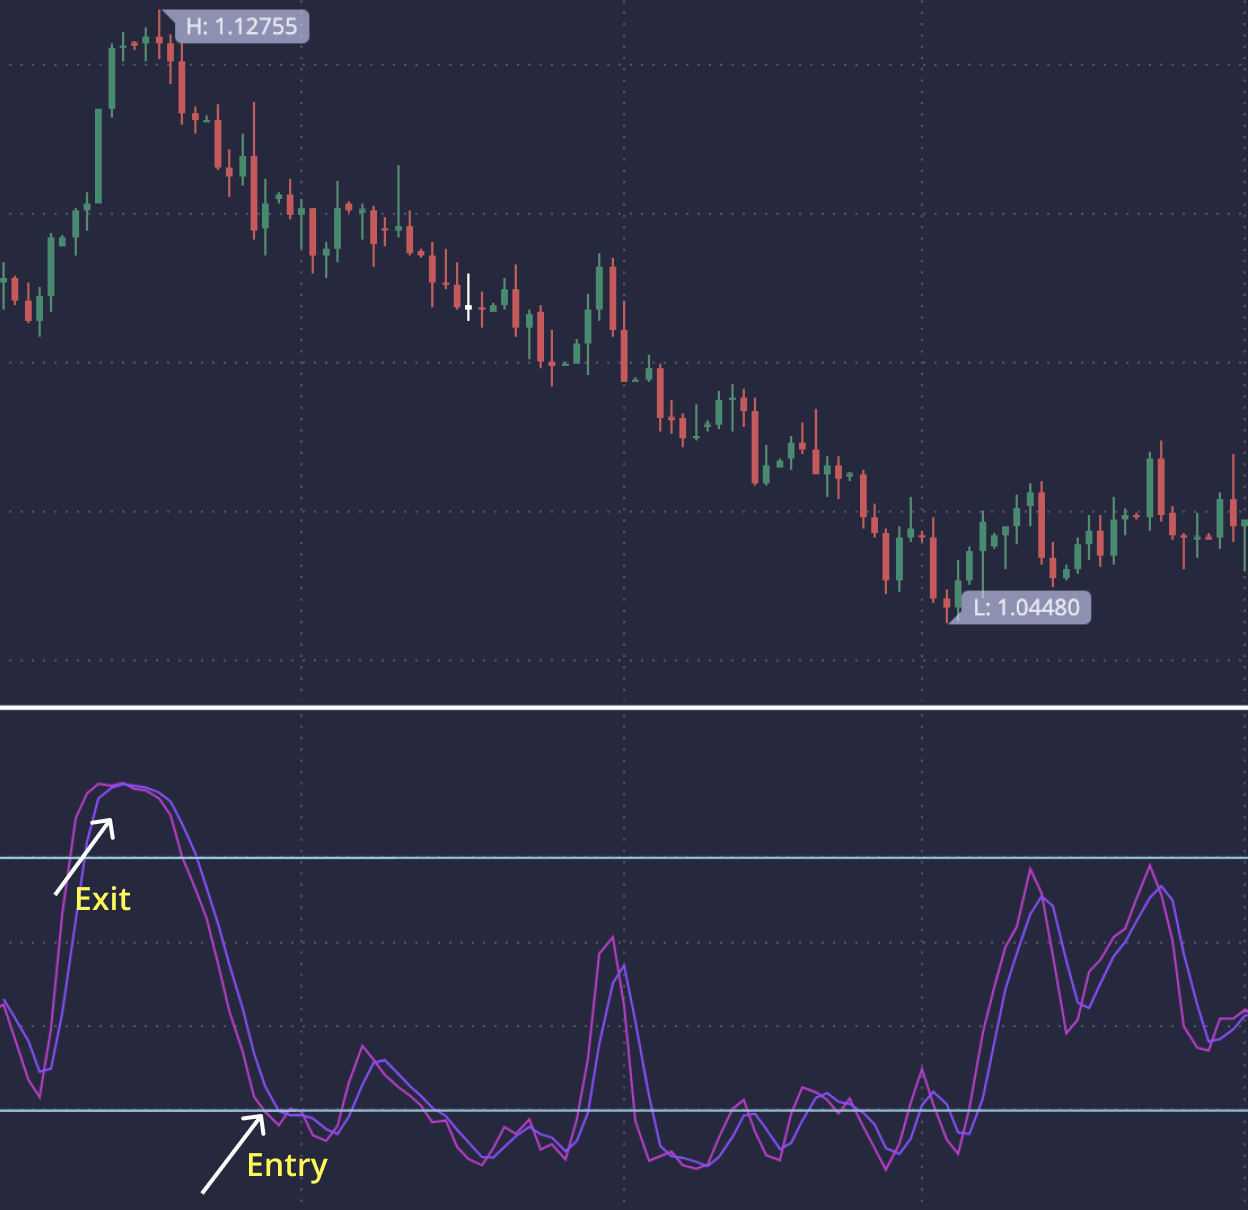
3. Precision in Entry and Exit Points.
Traders employ stochastic oscillator strategies to hone their entry and exit points with surgical precision. By synchronizing stochastic signals with other technical indicators and prevailing market conditions, traders elevate the likelihood of executing successful trades while mitigating risks.
4. Synergy with Trend Analysis.
Traders seamlessly meld stochastic oscillator signals with trend analysis, thereby illuminating the path to optimal entry and exit points. The amalgamation of stochastic oscillator readings with trend lines or channels empowers traders to navigate the market terrain with finesse, augmenting overall trading prowess.


Enhancing Precision with Fibonacci Levels
Unveiling Potential Entry and Exit Points
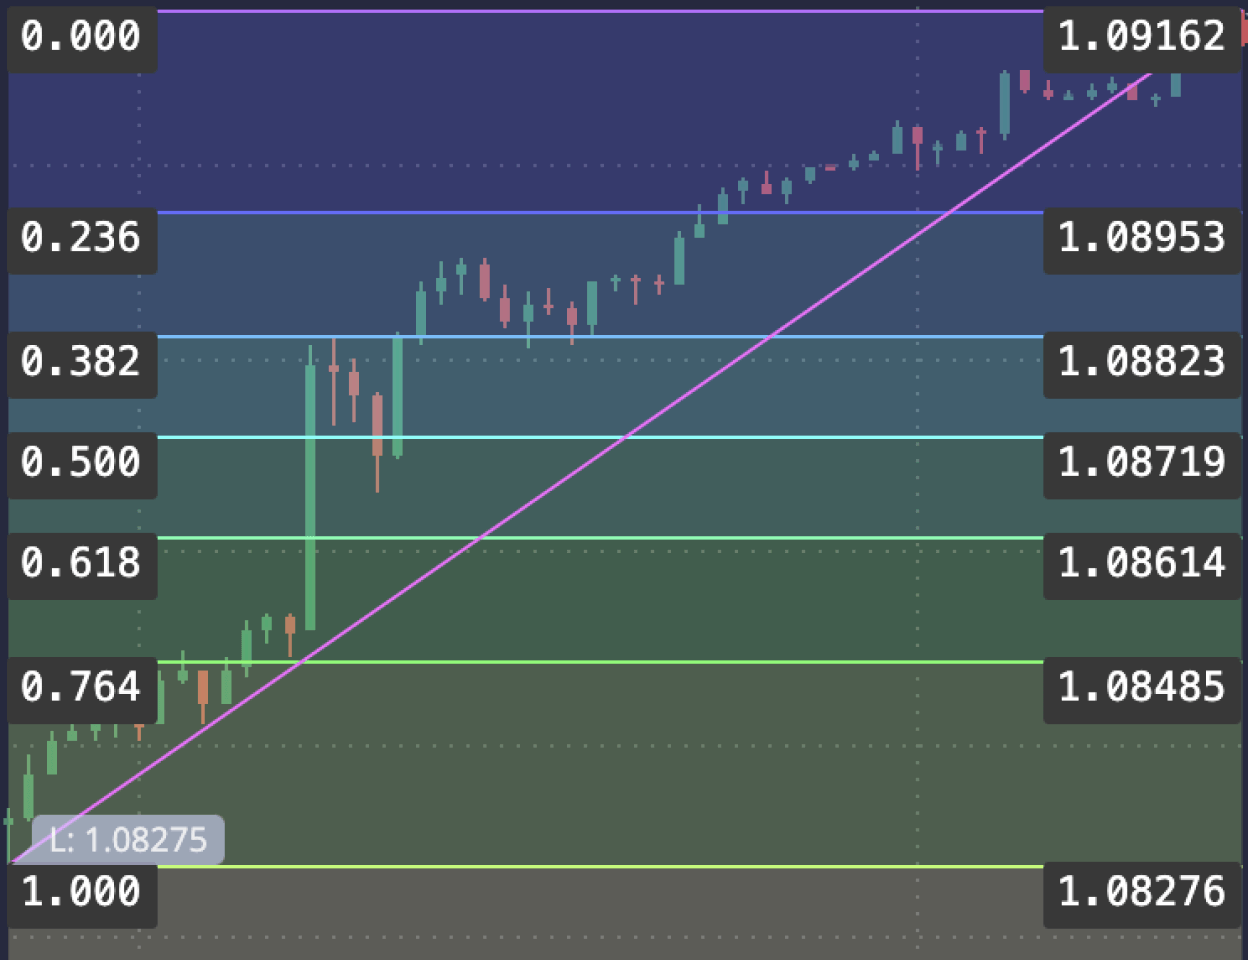
This strategic alliance marries the stochastic oscillator with Fibonacci levels to pinpoint prospective entry and exit junctures in trading. Derived from the revered Fibonacci sequence, these levels serve as beacons of support and resistance within the market fabric. Meanwhile, the stochastic oscillator, wielding its prowess in measuring momentum and flagging overbought and oversold conditions, complements the endeavor.

Leveraging Fibonacci Levels
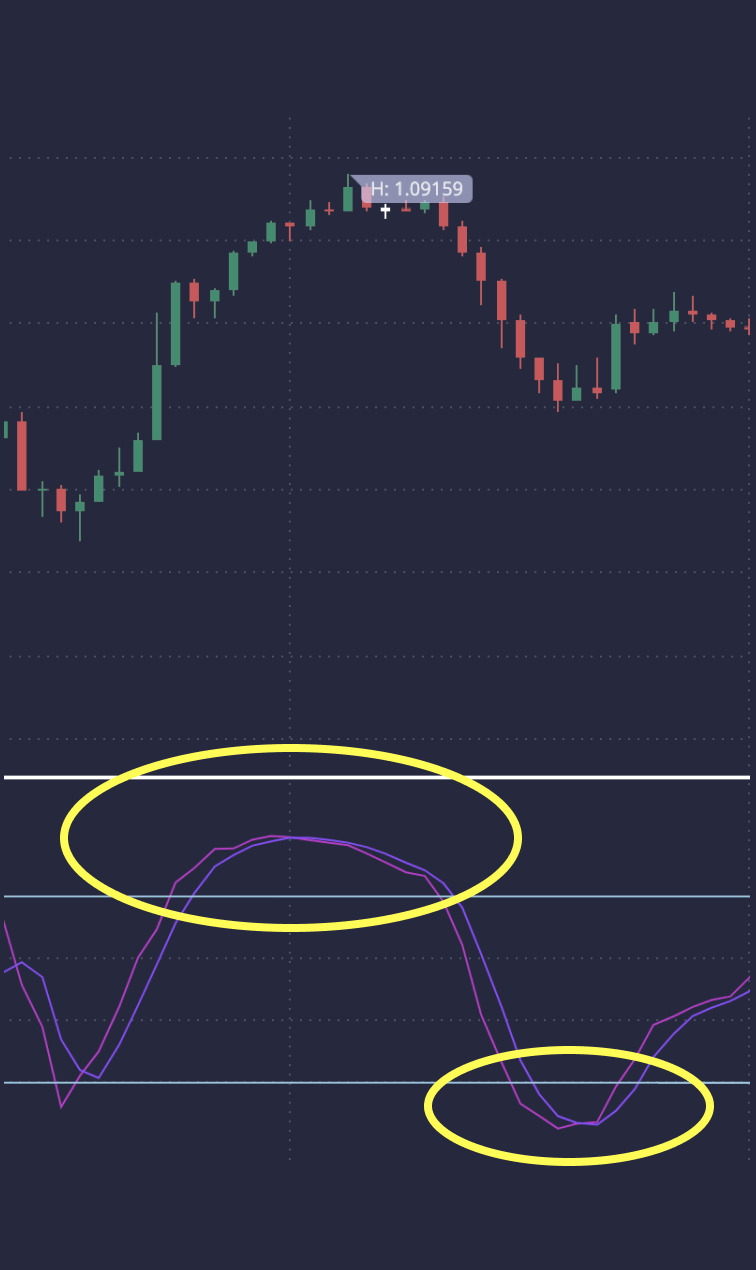
When the stochastic oscillator descends below 20, signaling oversold realms, or ascends above 80, hinting at overbought domains, traders turn to Fibonacci levels to refine their trading maneuvers. Within the stochastic oscillator’s range of 20 to 80, Fibonacci levels aid traders in discerning pivotal price thresholds where trends may either reverse or persist.
Integrating Candlestick Patterns: A Comprehensive Approach
SYNERGY BETWEEN STOCHASTIC OSCILLATOR AND CANDLESTICK PATTERNS
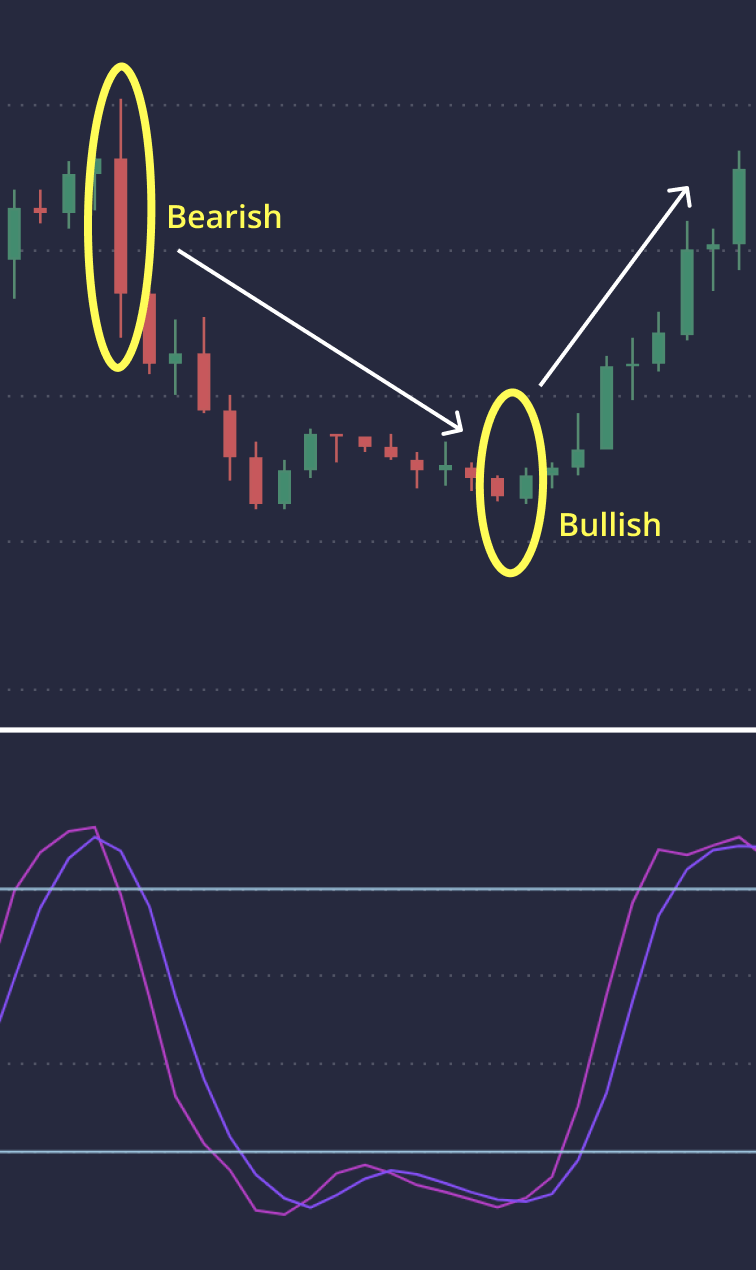
This comprehensive trading paradigm marries the stochastic oscillator with candlestick patterns to unearth potential trade vistas. Renowned for their ability to unveil shifts in market sentiment, candlestick patterns intertwine seamlessly with stochastic oscillator readings, enhancing trade accuracy.
IDENTIFYING MARKET CONDITIONS
Traders commence by identifying overbought and oversold market realms using the stochastic oscillator. Readings exceeding 80 denote overbought territories, while those dipping below 20 signify oversold domains. Subsequently, traders delve into the analysis of candlestick patterns, seeking cues for potential market reversals.
APPLICABILITY AND EFFICACY
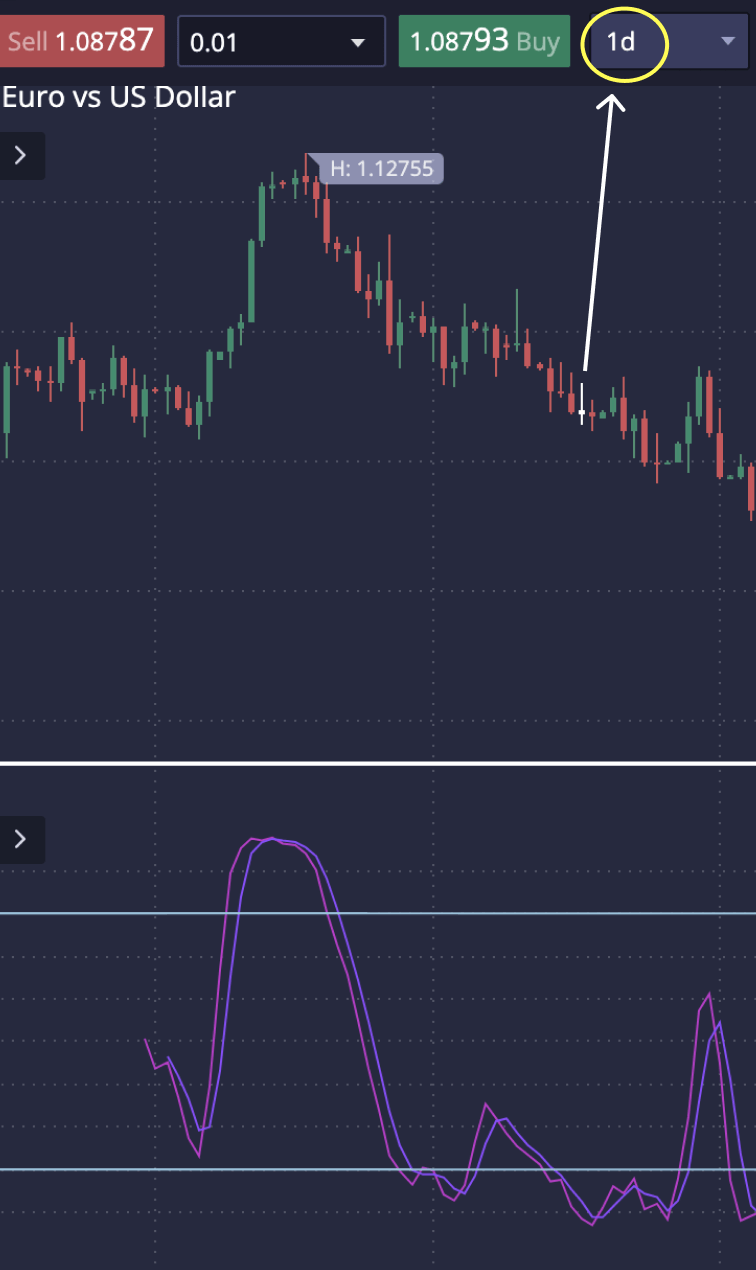
This multifaceted strategy finds resonance across diverse timeframes and markets, though it often yields optimal results on higher timeframes such as the daily chart. Catering to both short-term and long-term trading objectives, the signals generated by this strategy accommodate the spectrum of trading styles, from swing trading to trend following.
The stochastic oscillator emerges as a beacon of insight within the realm of technical analysis, aiding traders in gauging the momentum of financial instruments. By delving into the intricacies of interpreting stochastic oscillator readings and integrating supplementary tools like Fibonacci levels and candlestick patterns, traders can fortify their decision-making process. However, prudence dictates acknowledging the inherent risks inherent in trading and conducting thorough research before executing any trades, thus ensuring the implementation of prudent risk management practices.


FAQ
The stochastic oscillator stands out as a momentum indicator, analyzing an asset’s closing price relative to it’s high and low prices over a specific period. Unlike many other indicators, it provides insights into overbought and oversold conditions, aiding traders in identifying potential reversals or continuations in trends. While many indicators focus solely on price movements, the stochastic oscillator offers a unique perspective on market dynamics, helping traders anticipate potential shifts in trends.
Fibonacci levels act as critical support and resistance levels within the market prices structure. This synergy allows traders to refine their trading decisions based on both momentum and key price levels. This combination of momentum analysis and price-based levels strengthens traders’ confidence in their trading decisions.
Yes, the stochastic oscillator strategy is versatile and applicable across various timeframes and markets. Whether trading stocks, currencies, or commodities, traders can adjust the strategy to suit their preferred timeframe and market conditions, making it a valuable tool for traders with diverse trading preferences.
When implementing the stochastic oscillator strategy, traders often look for candlestick patterns to confirm potential trade setups, such as the hammer, doji, and engulfing patterns provide visual cues of market sentiment and potential reversals. These patterns, when combined with stochastic oscillator readings, provide valuable insights into market sentiment and potential price reversals. By incorporating the patterns alongside stochastic oscillator readings, traders gain a more comprehensive understanding of market dynamics, improving the accuracy of their trading decisions.