
EMA Insights: From Basics to Advanced Trading Techniques
Explore the strategic application of the Exponential Moving Average (EMA) in trading, covering trend identification, diverse trading approaches, and risk management strategies to elevate your trading practice.
Exploring the EMA Trading Strategy
The EMA trading strategy revolves around the Exponential Moving Average (EMA), a pivotal technical indicator revered for its proficiency in pinpointing market trends and discerning potential entry and exit points.
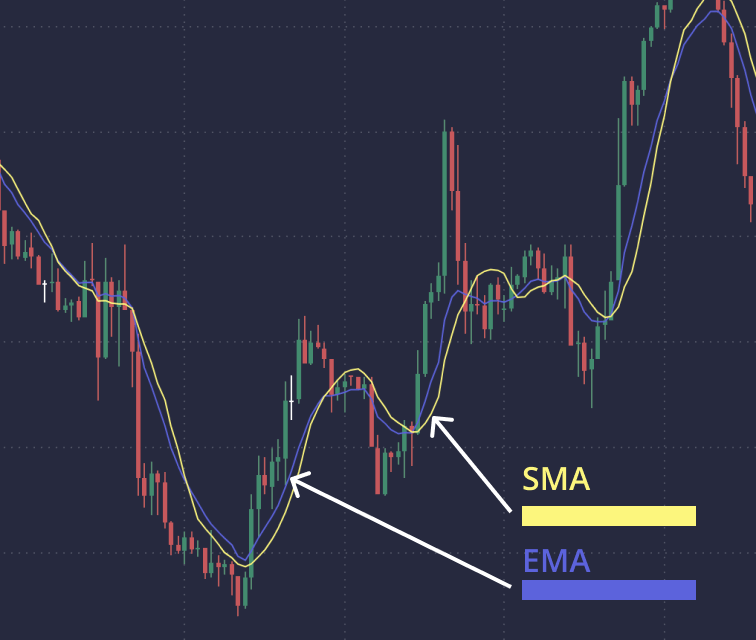
At the heart of this strategy lies the EMA, a dynamic variant of the traditional moving average, renowned for its emphasis on recent price data over its Simple Moving Average (SMA) counterpart. This heightened responsiveness renders the EMA particularly adept at adapting to prevailing market dynamics.
A cornerstone of the EMA trading approach is the crossover strategy, entailing the vigilant observation of two or more EMAs across divergent timeframes to extract potential trading cues.
By juxtaposing EMAs with varying durations, traders can glean valuable insights into evolving market trends and opportune moments for market entry or exit.
When assessing potential trends using EMA, traders closely monitor the trajectory of the EMA line in relation to the price chart.
Integrating the EMA with other technical indicators such as the Relative Strength Index (RSI) or Moving Average Divergence and Convergence (MACD) can improve trend following performance.
Smart risk management, coupled with discipline, patience and emotional balance, are key components of any trading strategy, including those based on the principles and variables contained in the EMA.
Revealing the essence of the EMA indicator
An exponential moving average (EMA) is a type of moving average that gives more weight to recent price data, thereby making it more sensitive to prevailing market dynamics. Although most platforms automate the EMA indicator, understanding the mechanism behind it can help traders use it more effectively and customize it individually.
To compute the Exponential Moving Average (EMA), traders commence by establishing the initial average over a specified period, which serves as the foundation for subsequent computations. The EMA formula entails a meticulous process, involving the multiplication of the preceding day’s EMA by a smoothing factor, followed by the addition of the resultant value to the current day’s price data.
The benefits of employing the EMA are multifaceted: it boasts rapid responsiveness to recent price fluctuations while adeptly sieving through market noise. Nonetheless, its susceptibility to short-term price volatility renders it prone to generating erroneous signals.
The exponential moving average formula, delineated as follows, encapsulates its essence:
Today's EMA = (Today's Price * (2 / (N + 1))) + (Yesterday's EMA * (1 - (2 / (N + 1))))
- EMA_today symbolizes the EMA value for the ongoing day.
- Price_today signifies the closing price of the asset for the ongoing day.
- N represents the chosen period (in days) for the EMA.
- EMA_yesterday signifies the EMA value for the preceding day.
In cases where the previous day’s EMA is not available, the start of the initial period SMA calculation serves as the baseline for the EMA calculation.
Setting up the EMA indicator
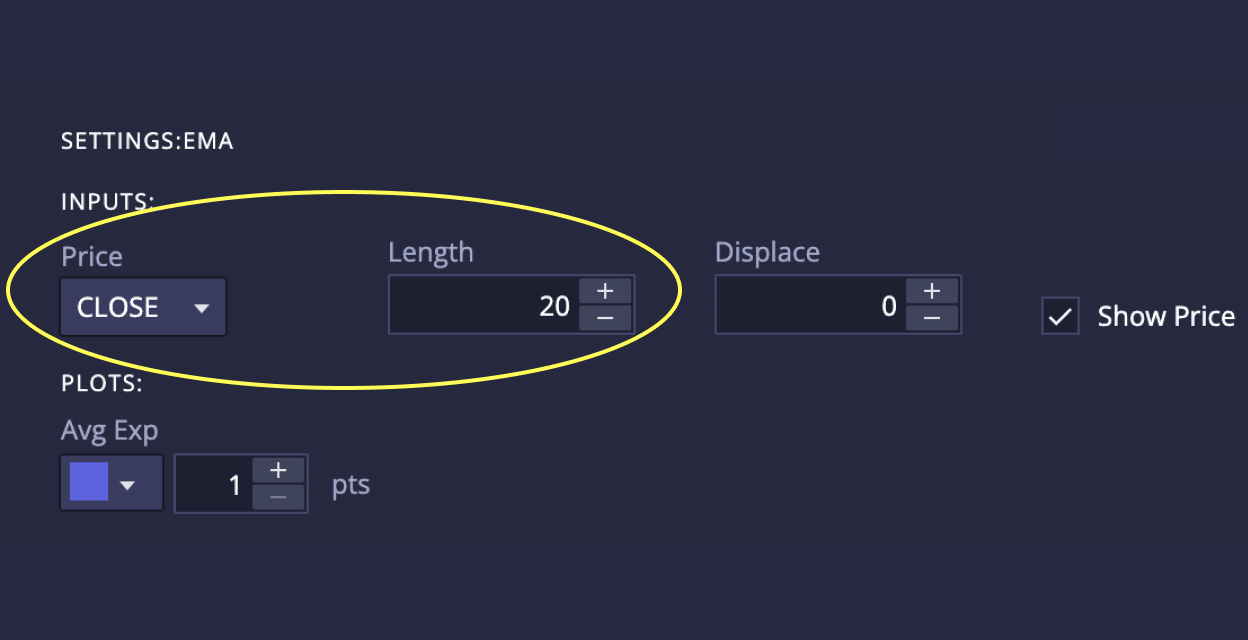
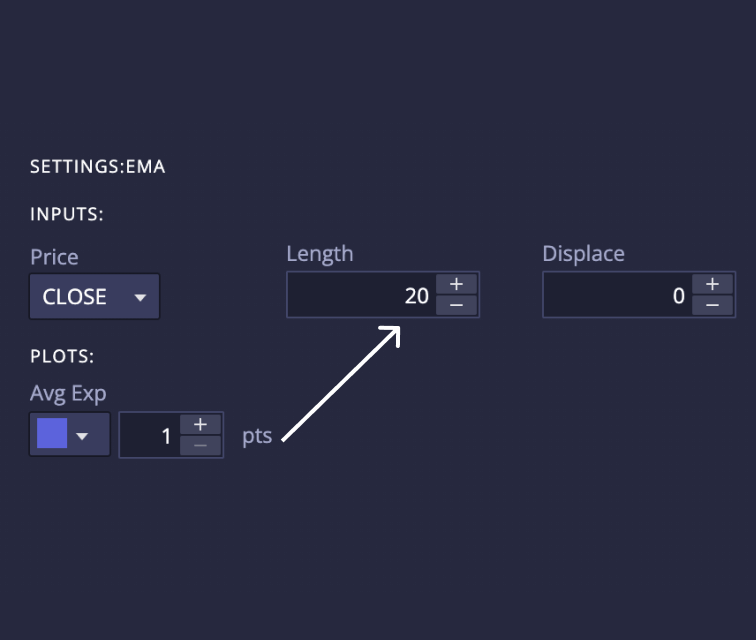
Setting up the EMA indicator includes determining the timeframe for which the average value will be calculated, as well as choosing the appropriate weight or smoothing coefficient. These settings allow traders to customize the EMA to suit their preferred trading approach.
For example, day traders may choose a shorter period to closely monitor recent price movements, while position traders may choose a longer period to capture the overall trend and filter out short-term volatility.


Using EMA in Trading
The versatility of the EMA allows it to be used in trading in a variety of innovative ways, depending on the trader’s preferences. Below are some popular methods of using the indicator.
Trend analysis using EMA
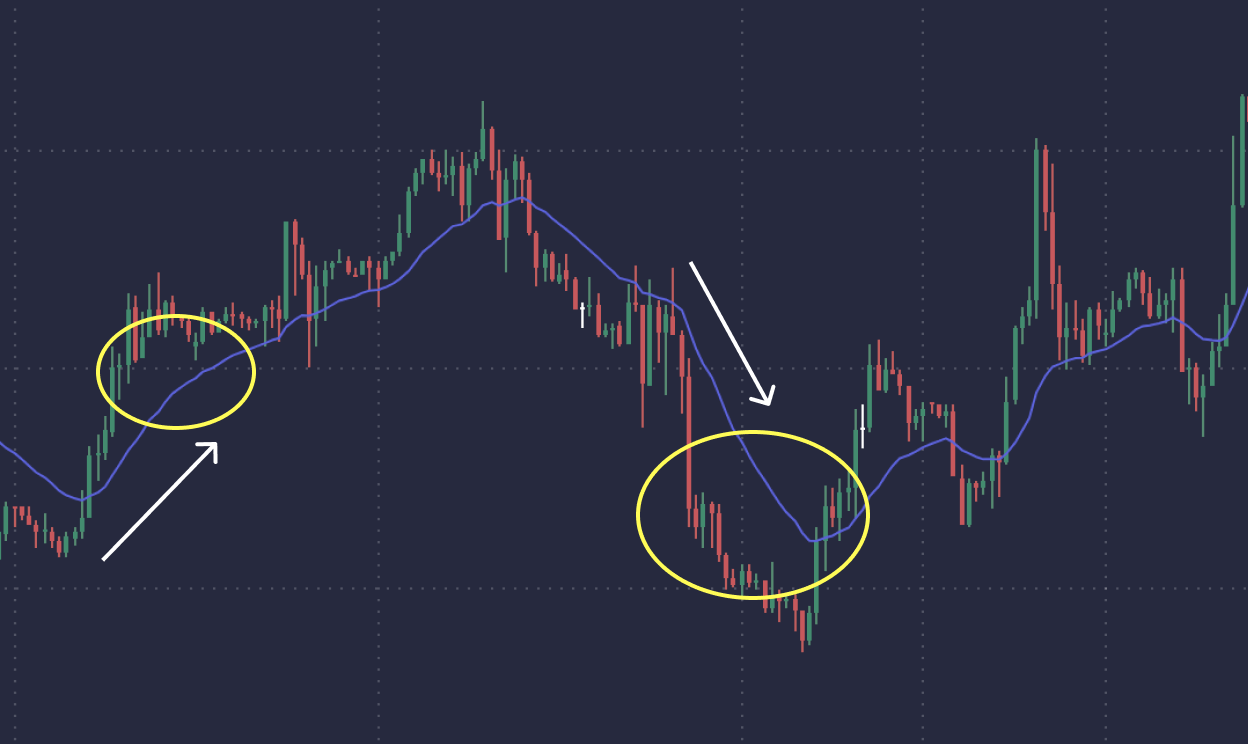
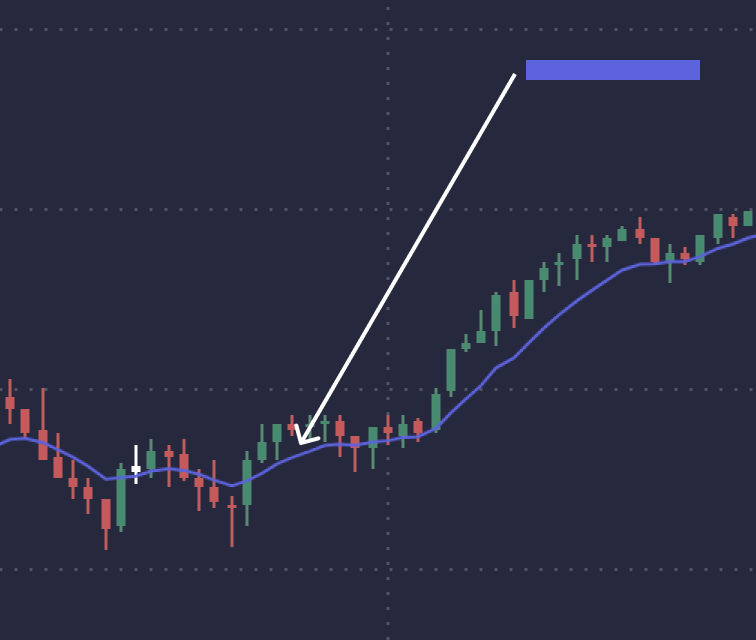
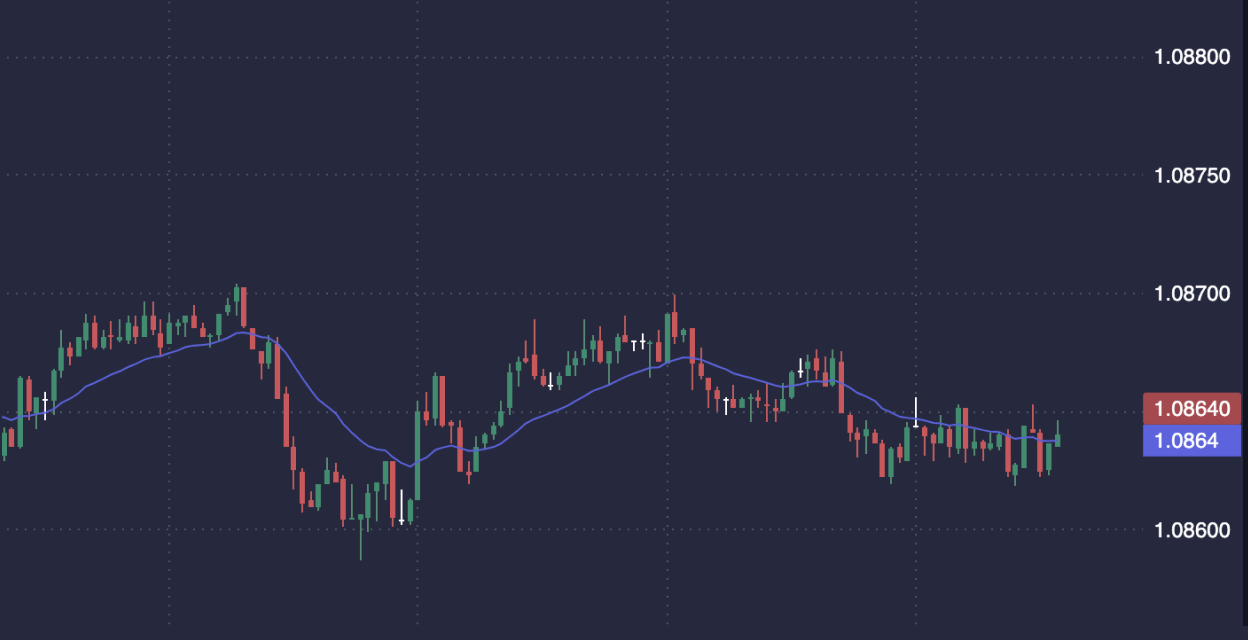
When determining a trend, traders can observe the trajectory of the EMA line relative to the price chart. When the EMA moves up and is below the price, it usually signals bullish momentum. Conversely, if the EMA moves down and is above the price, it may indicate a bearish trend. Analyzing the direction of the EMA along with the price position is critical to accurately identifying the trend.
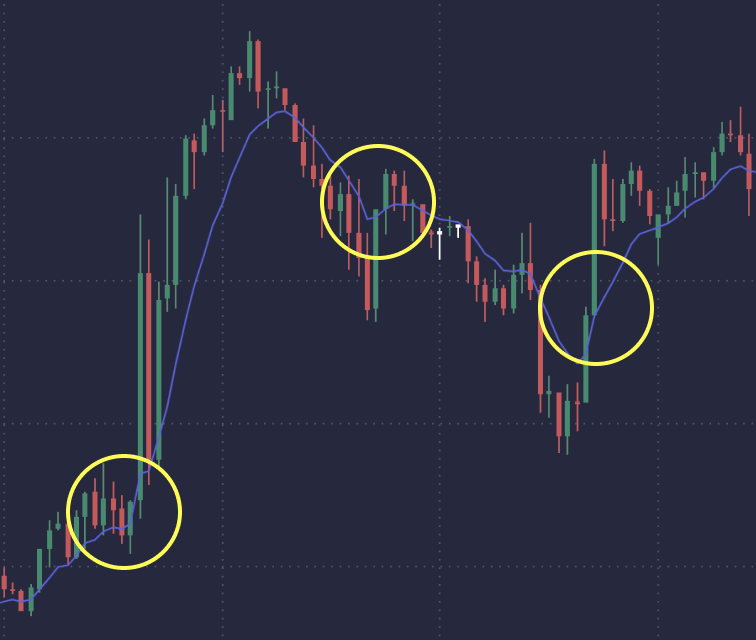
Moreover, EMA can function as dynamic support and resistance levels, providing necessary information about potential reversals or continuation of price movements. By monitoring the interaction between the EMA line and price, traders can assess the strength of the prevailing trend.
EMA crossing strategy
Using an EMA crossing strategy involves monitoring two or more EMAs with different timeframes to detect trading signals. A bullish indication emerges when the shorter-term Exponential Moving Average (EMA) surpasses the longer-term EMA, hinting at a potential uptrend in the market.
Conversely, a bearish signal materializes when the short-term EMA crosses below the longer-term EMA, suggesting a possible downtrend.
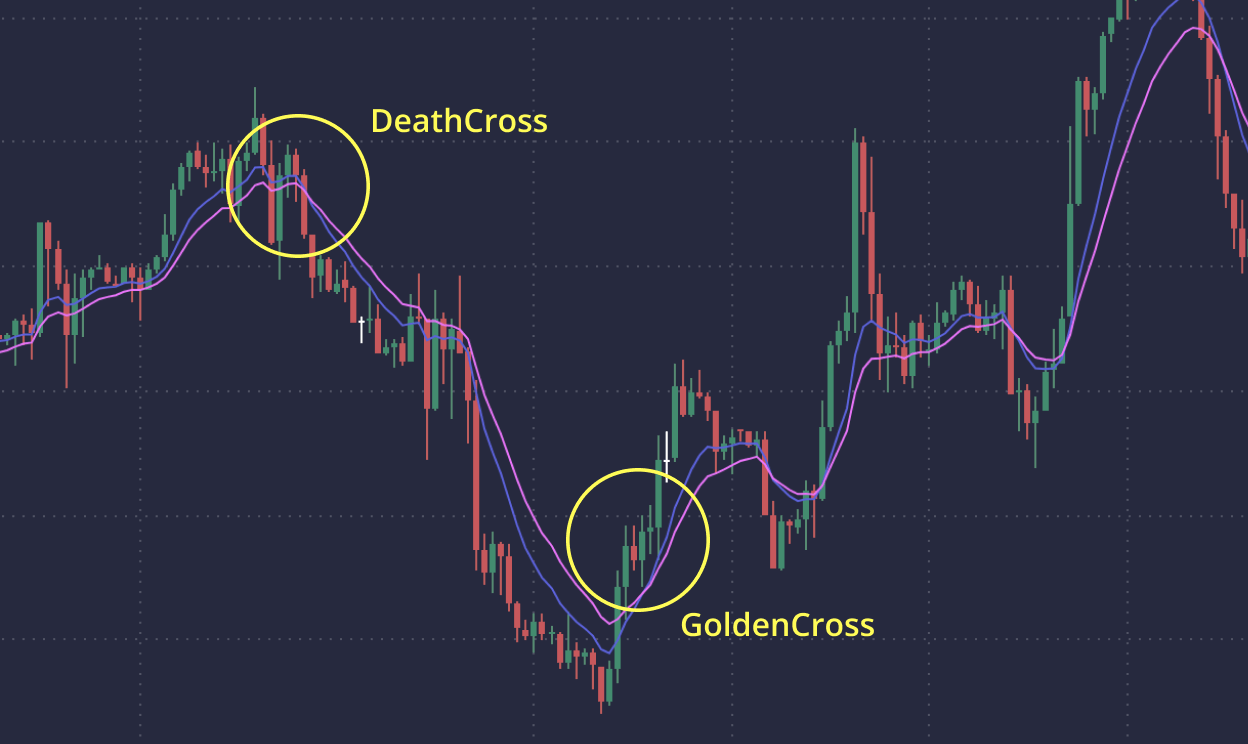
Within the realm of EMA crossings, two primary configurations reign supreme: the “golden cross” and the “death cross.”
The former transpires when the short-term EMA eclipses the long-term EMA, indicating a prospective surge in prices. On the flip side, the latter unfolds when the short-term EMA descends beneath the long-term EMA, foretelling a plausible decline in prices.
For the successful implementation of this trading strategy, vigilance is paramount. Traders must meticulously track EMA crossover points and subsequent price fluctuations. Moreover, they should factor in other technical indicators and prevailing market conditions to validate the reliability of these signals.
Integration of EMA Strategy with Additional Tools
EMA & Moving Average (MA). This approach amalgamates short-term EMAs with long-term Simple Moving Averages (SMAs) to generate buy or sell signals based on their respective crossovers.
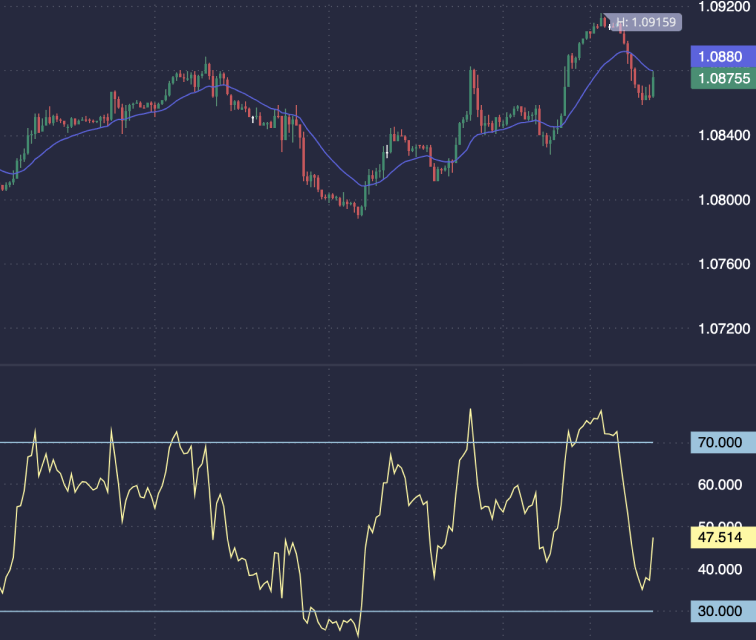
EMA & Relative Strength Index (RSI). By fusing the EMA with the RSI, traders can augment the efficacy of their trend-following methodology. The RSI aids in pinpointing overbought or oversold conditions, thereby validating EMA-based trading signals.
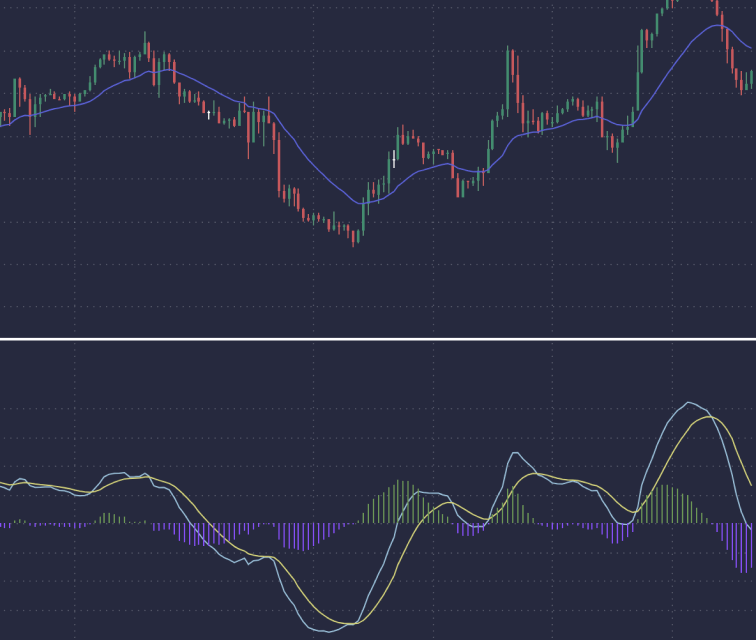
EMA & Moving Average Convergence Divergence (MACD). Leveraging the MACD indicator in conjunction with the EMA enables traders to gauge both the direction and strength of a trend by scrutinizing the relationship between two EMAs.
Understanding the Psychology of Trading helps in Risk Management Strategies
Trading psychology is a key factor determining success in any trading activity, including the EMA trading methodology. Maintaining discipline, patience and emotional balance allows traders to avoid common mistakes such as impulsive decision-making and over-trading.
Equally important is sound risk management, which includes several effective methods:
• The use of stop loss orders involves setting a predetermined price level, upon reaching which a losing trade is automatically closed, reducing potential losses. (Note that only paid guaranteed stop losses provide slippage protection).
• Using profit taking orders sets a target level for closing a trade once the desired price is reached.
• Position sizing indicates the appropriate number of contracts or shares to trade within a single position, based on the trader’s risk tolerance, account size, and the specific characteristics of the asset or instrument.
• Adopting a diversification strategy involves trading different assets or instruments in order to reduce risks and mitigate the impact of adverse market changes on the overall portfolio.
• Assessing the ratio of the risk of potential loss and profit helps traders assess the prospects of a transaction before executing it and its feasibility from the point of view of money management.
• Practicing the strategy on a demo account. Before using an EMA-based trading strategy in real markets, traders can hone their approach by practicing on a demo account. This risk-free environment makes it easy to experiment with different settings and methods, allowing traders to perfect their custom settings before committing real capital to a trade size.


Conclusion
To summarize, the EMA indicator serves as a powerful tool for identifying market trends and potential entry and exit points. The EMA methodology, which is more responsive than the SMA, places greater weight on the latest price data, allowing it to effectively navigate today’s market dynamics.
Additionally, EMA-based strategies, such as monitoring the direction of the EMA or using crossover signals between two EMAs, as well as integrating
the EMA with additional indicators such as RSI and MACD, give traders a more valuable holistic view of the market situation in the decision-making process.
It is always vital to recognize the influence of trading psychology and implement sound risk management techniques. Conducting thorough due diligence before trading and refraining from risking losing more capital than you can afford to lose are fundamental principles of sound trading practice.
FAQ
While the EMA can provide insight into market trends and potential reversals by highlighting recent price movements more clearly, it cannot predict market reversals with certainty. Traders often use the EMA in combination with other analysis tools and indicators to more accurately identify potential turning points.
A crossover occurs when two EMAs of different periods intersect on the chart. An upward crossover (shorter EMA crosses over a longer EMA) often indicates a potential bullish trend, while a downward crossover (shorter EMA crosses over a longer EMA) can indicate a bearish trend.
The choice of period for calculating the EMA affects its sensitivity to price changes. An EMA with a shorter period will be more sensitive and will closely monitor price movements, providing more trading signals. In contrast, a longer period EMA smooths out price fluctuations over time, offering a clearer picture of the long-term trend, but with delayed signals.
The EMA indicator can be effective in trending markets, helping to determine the direction and strength of the trend. However, its effectiveness may be reduced in fluctuating or highly volatile markets where price movements are less predictable, which may result in false signals. Traders often adjust EMA parameters or combine them with other indicators to mitigate these problems.