
Unveiling the Power of RSI in Technical Analysis and Trading Strategy
This detailed overview will take you deeper into using the Relative Strength Index (RSI) for your trading strategy. Learn the history, formula, and integration of the RSI indicator along with various other technical analysis tools.
What is RSI?
The Relative Strength Index (RSI) stands as a pivotal instrument within a trader’s toolkit for technical analysis, meticulously crafted to assess the price dynamics of a security across a designated timeframe.
By tracking the speed and magnitude of directional price movements, RSI assigns a score from 0 to 100, which sheds light on potential overbought or oversold conditions and signals possible changes in market direction.
The versatility of the RSI allows it to adapt to all trading areas and asset categories, including stocks and forex, offering traders a wide range of strategies to implement.
Basic Moments
The RSI index serves as an indicator of the intensity of price fluctuations, identifying market scenarios in which assets are either overvalued or undervalued.
Traders can adapt the RSI to different timeframes and periods to suit their specific strategic needs.
Strategies using the RSI include identifying buying or selling extremes, crossing the midline (50 mark), divergences from price action, and identifying so-called “failure swings” as signals for potential reversals.
Enhancing RSI analysis by combining it with other analytical tools such as moving averages, Bollinger Bands, MACD, stochastic oscillators and Fibonacci retracements can provide a more detailed understanding of market dynamics.
Despite its usefulness, the RSI indicator is not without its drawbacks, including the risk of misleading signals and an inability to predict the magnitude of price movements.
Studying the RSI Indicator
The Relative Strength Index (RSI) is a momentum indicator belonging to a group of oscillators. It was developed by John W. Wilder Jr. (1935-2021) in 1978, an engineer and an experienced stock trader, the author of several classic indicators. The RSI (Relative Strength Index) measures changes in price movements. Working on a scale from 0 to 100, the RSI shows overbought or oversold zones when trading an asset, thereby indicating potential turning points in the market. The indicator is pre-installed in MT4 and MT5, and is widely used in the field of technical analysis for various financial instruments on the stock market and FOREX.
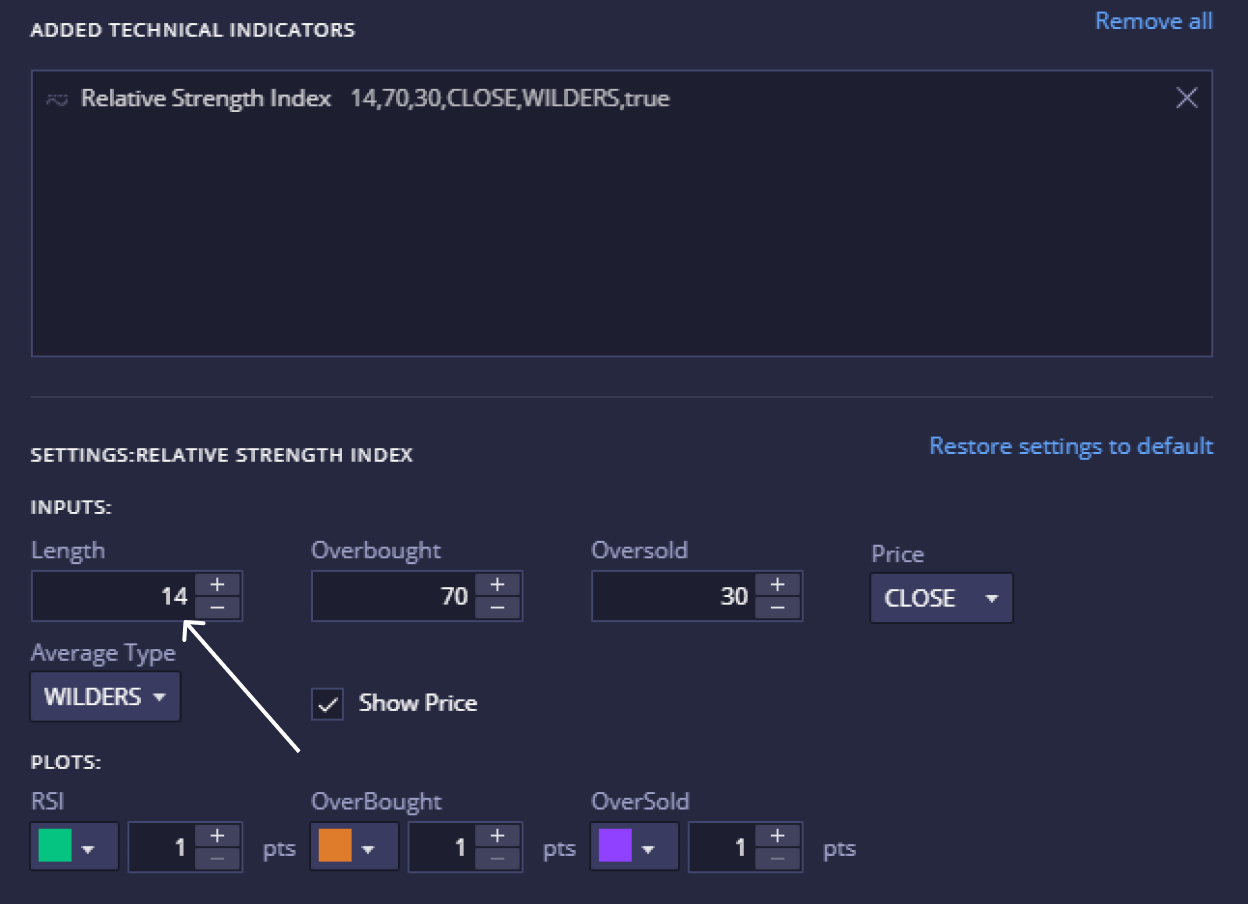
The RSI, like other oscillators, is usually displayed below the main trading chart. It is versatile and applicable on a variety of chart timeframes, from minutes to weeks, making it suitable for a wide range of trading strategies, including intraday and swing trading. The RSI’s adaptability is further emphasized by its customizable periodic settings. Although the traditional period set by Wilder is 14, traders often change it to 2, 9, or even 50 periods to better suit their specific trading approaches. For example, day traders can shorten the period to 7 or 10 days to increase the indicator’s sensitivity to immediate price changes.
Taking a Deeper Study of the RSI Indicator
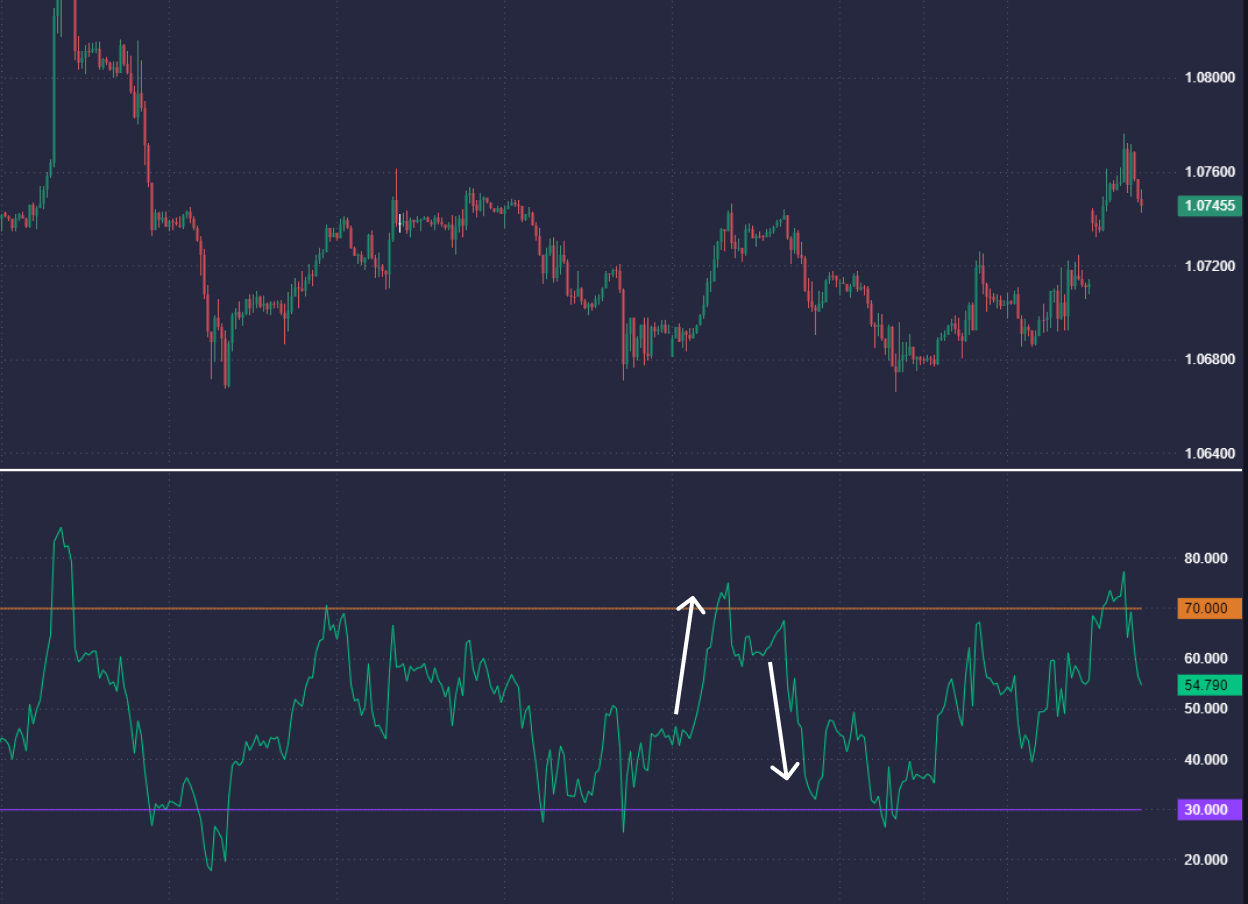
The RSI index evaluates price movement by comparing the magnitude of recent gains with recent losses, scoring on a scale from 0 to 100. This value provides insight into the current strength or weakness of a security’s price movement. A reading above 70 usually indicates the asset is overbought, suggesting that it may be overvalued and perhaps preparing for a price correction. Conversely, a reading below 30 indicates that the asset is oversold, indicating undervaluation and the possibility of a quick price recovery.
Understanding RSI Calculation
While the intricacies of RSI calculation may not be important to all traders, understanding its underlying principles can be helpful. The RSI formula is based on the relative strength ratio (RS), which is the ratio of average gains to average losses over a selected number of periods, usually the standard 14 recommended by Wilder.
For Calculation
Average profit is determined by summing all upward price movements over a selected period and dividing by the number of periods.
Similarly, the average loss is calculated by summing all downward price movements and dividing by the number of periods.
RS is then calculated by dividing the average profit by the average loss.
This RS value is normalized to fit a scale of 0 to 100, giving the RSI value.
This methodical approach allows traders to gauge market sentiment by identifying potential overbought or oversold conditions through the lens of RSI.


Diving Deep into RSI Trading Strategies
The RSI trading strategy includes a set of rules and techniques that use the Relative Strength Index to determine promising trade entry points. These opportunities are identified by recognizing overbought or oversold conditions and changes in momentum. There are four main ways to use RSI in trading.
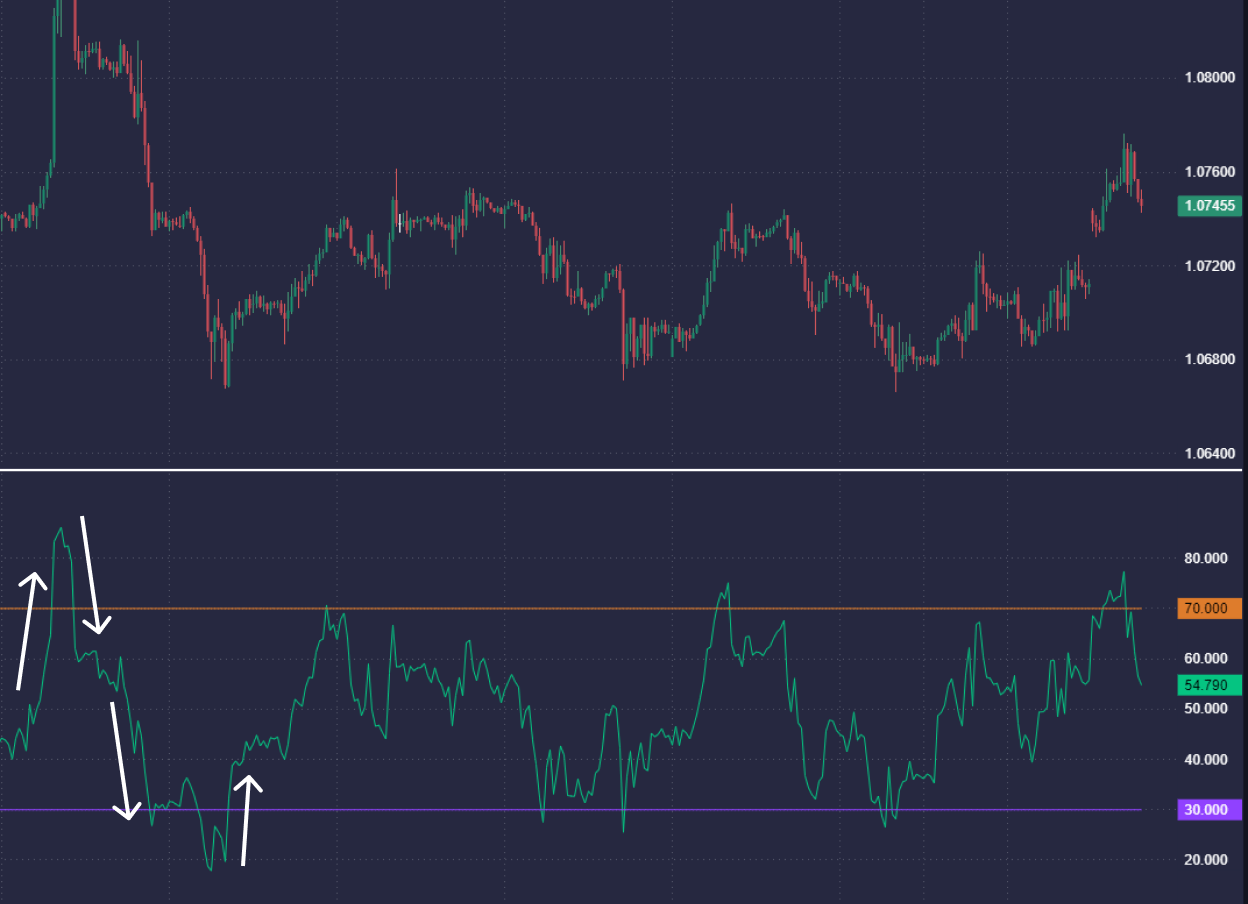
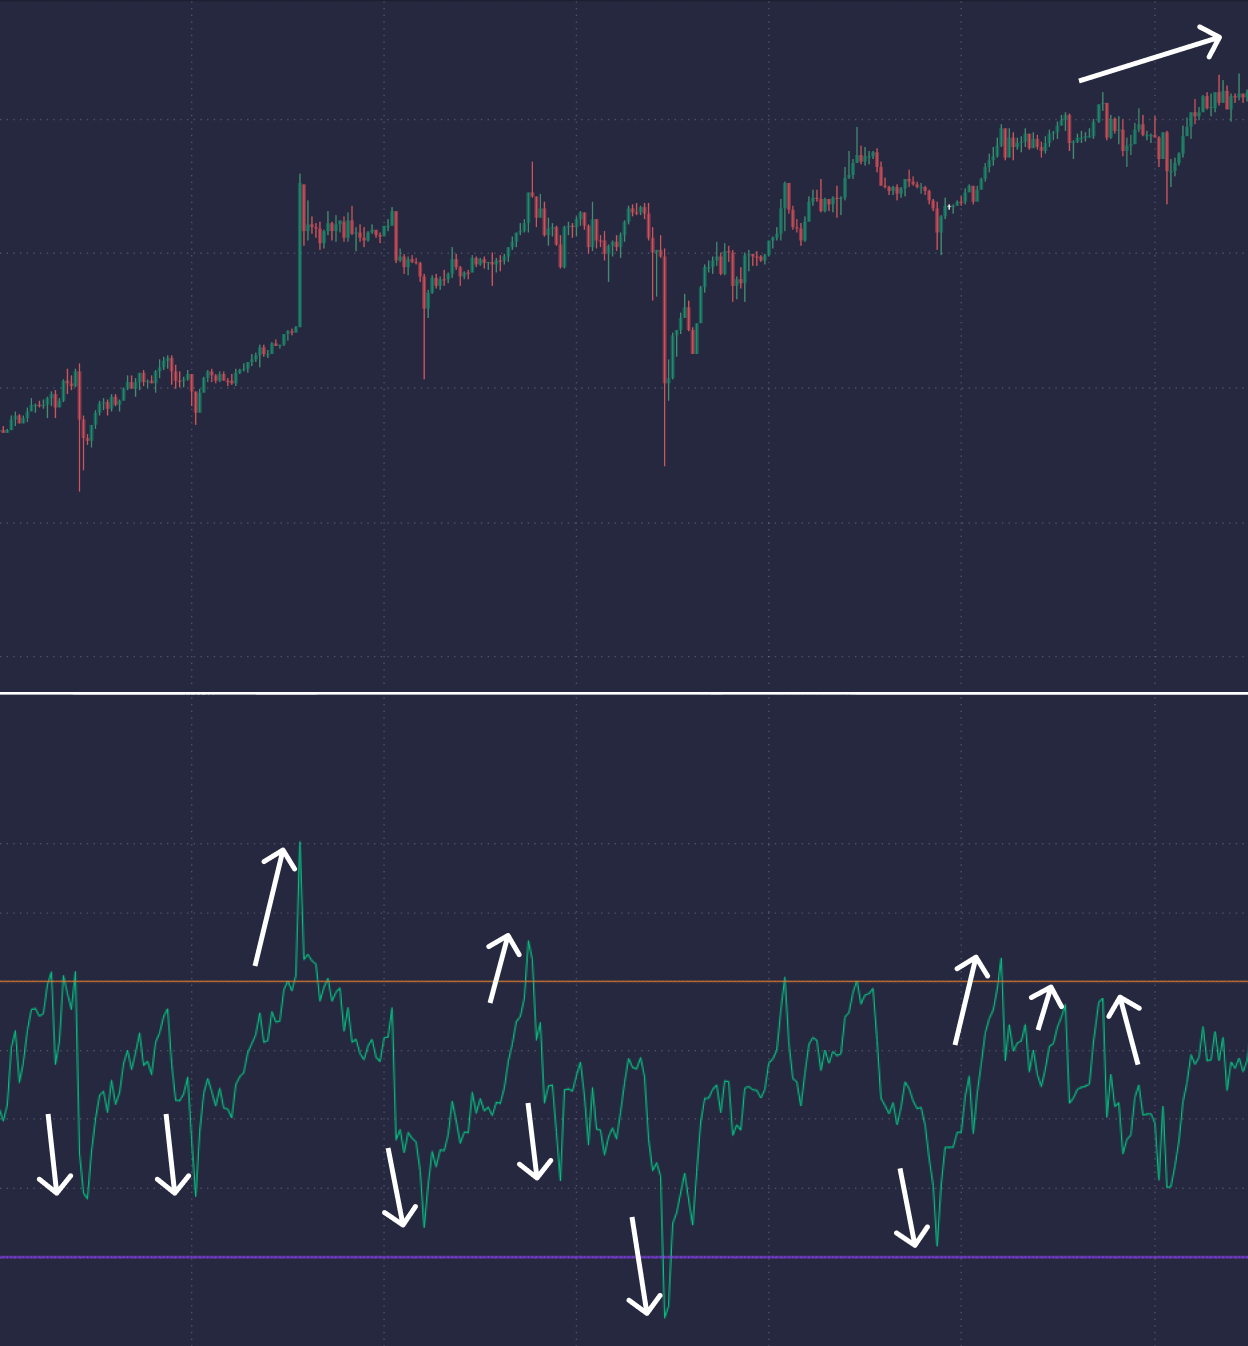
Determining Overbought and Oversold Conditions
As stated earlier, the RSI can signal that an asset has become overbought and is beginning to decline, indicating a potential price drop. Conversely, an oversold signal followed by an uptrending RSI could indicate an upcoming rise in the asset’s price. Followers of this strategy may want to wait until the RSI dips below 70, indicating an exit from overbought conditions, before considering going short. Likewise, a move above 30 could signal the possibility of going long, suggesting the asset is emerging from an oversold condition.
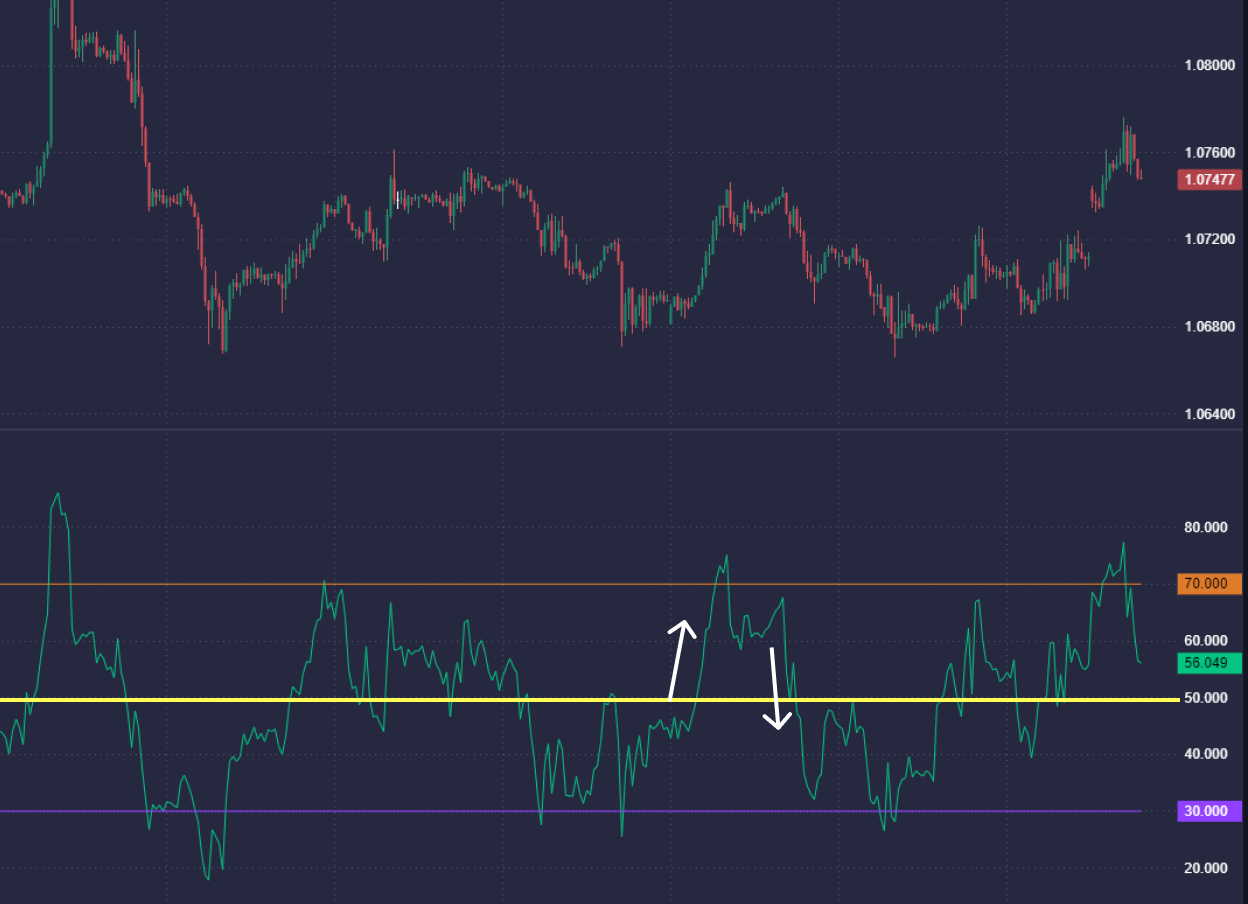
Based on the Intersection of the 50-level Range
The midpoint of the RSI, or level 50, serves as a marker confirming the presence of a price trend. According to this method, an RSI move below 50 from above signals the start of a downtrend. On the other hand, an RSI crossing above 50 indicates an emerging uptrend.

Exploring Divergence
Divergence trading involves looking for discrepancies between the RSI path and market price movements, which often signals an upcoming move. A bearish divergence is identified when the market price makes a new high while the RSI records a lower high. Conversely, a bullish divergence occurs when the market price falls to a new low, but the RSI index makes a higher low. The appearance of divergence indicates a higher likelihood of a price reversal, offering potential signals for short-term selling or buying opportunities.
Understanding RSI Fluctuations During Falls
Erratic RSI fluctuations, closely related to divergence, focus on more subtle movements within a trend, examining minor peaks and troughs in price action. During an uptrend, prices typically form higher peaks and troughs, while a downtrend is characterized by lower peaks and troughs. If the RSI deviates, falling while the price continues to rise, it could indicate an upcoming reversal in the short-term trend.
Each of these strategies leverages RSI’s ability to interpret market dynamics, offering traders detailed information about potential entry and exit points based on underlying momentum and market conditions.
Improving trading strategies using RSI and additional indicators
Combining the Relative Strength Index (RSI) with additional technical indicators can significantly enhance market analysis by providing greater insight into market trends and price movements. Here are a few well-established indicators that, when combined with RSI, can enhance an RSI-based trading approach.
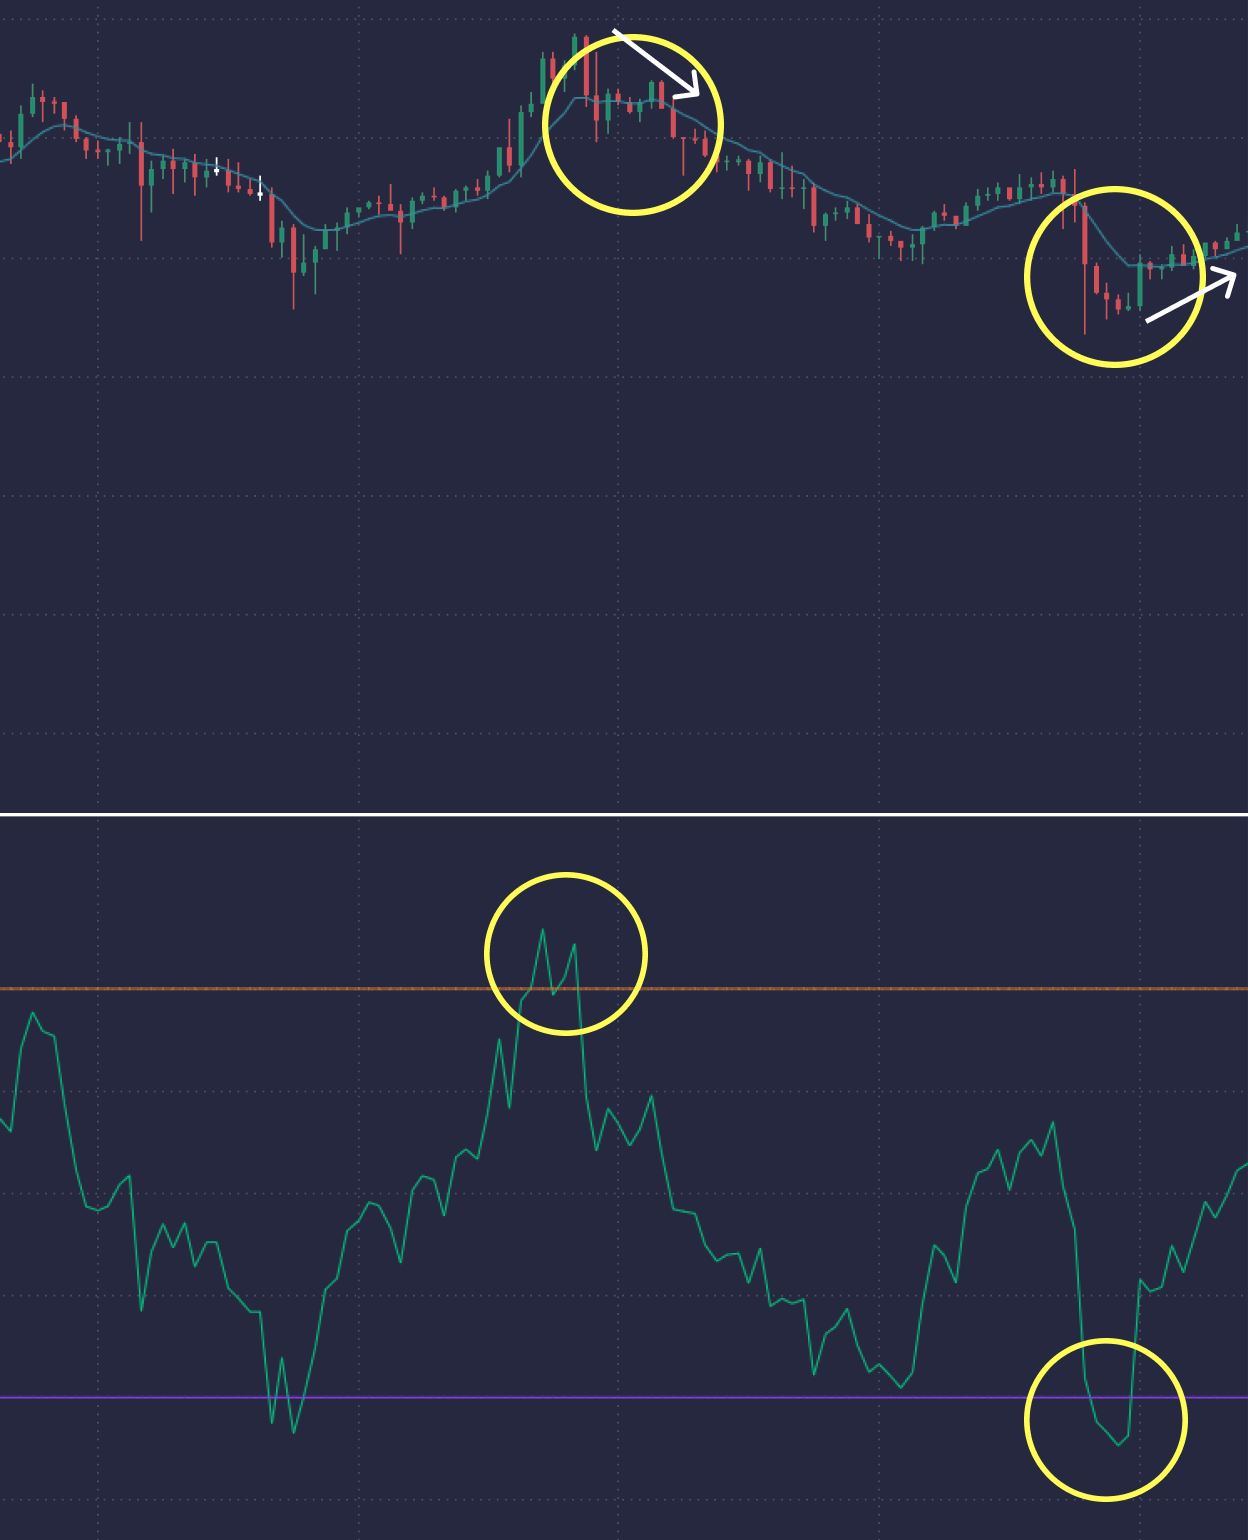
Integration with moving averages (MA)
Using moving averages along with RSI helps traders pinpoint trend directions and potential points to enter or exit a trade. A scenario in which the price of an asset moves above the moving average while the RSI rises above 30 could indicate a promising opportunity to enter a long position. Conversely, a situation where the price of an asset falls below its moving average, combined with an RSI greater than 70, can signal a possible short position.
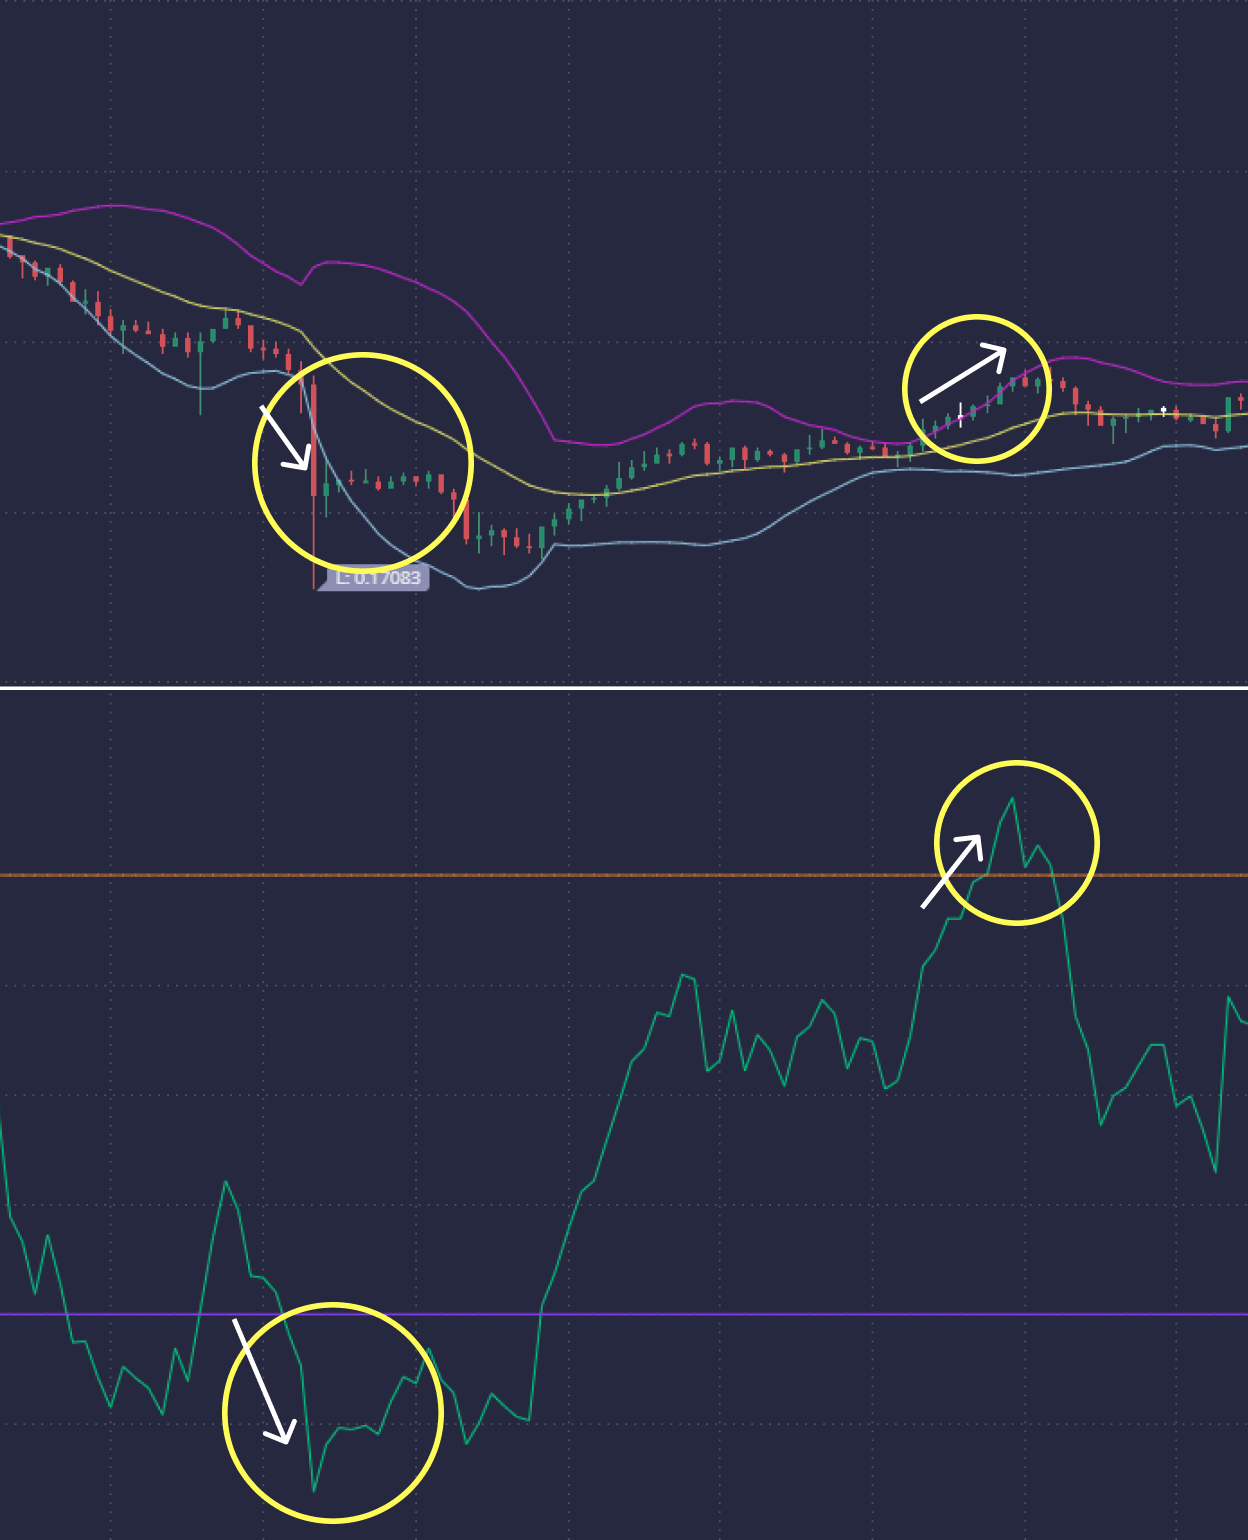
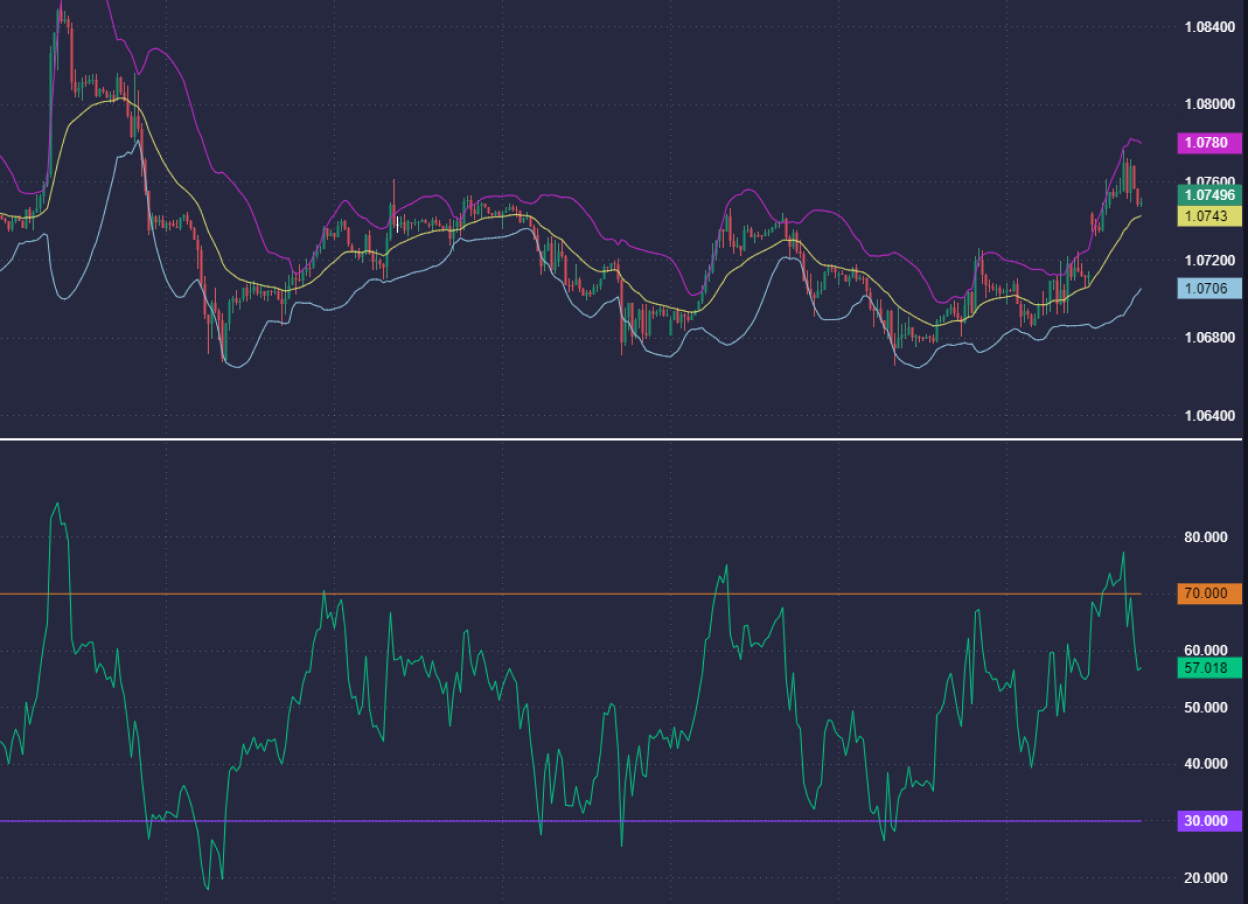
Synergy with Bollinger Bands
Merging Bollinger Bands with RSI gives traders a better understanding of market volatility and price extremes. An instance where an asset’s price reaches the upper Bollinger Band while the RSI also peaks above 70 could indicate that the asset is overextended, indicating an impending price correction. On the other hand, if the price touches the lower Bollinger Band in combination with the RSI below 30, it could indicate significant oversold conditions, signaling a potential buying opportunity.
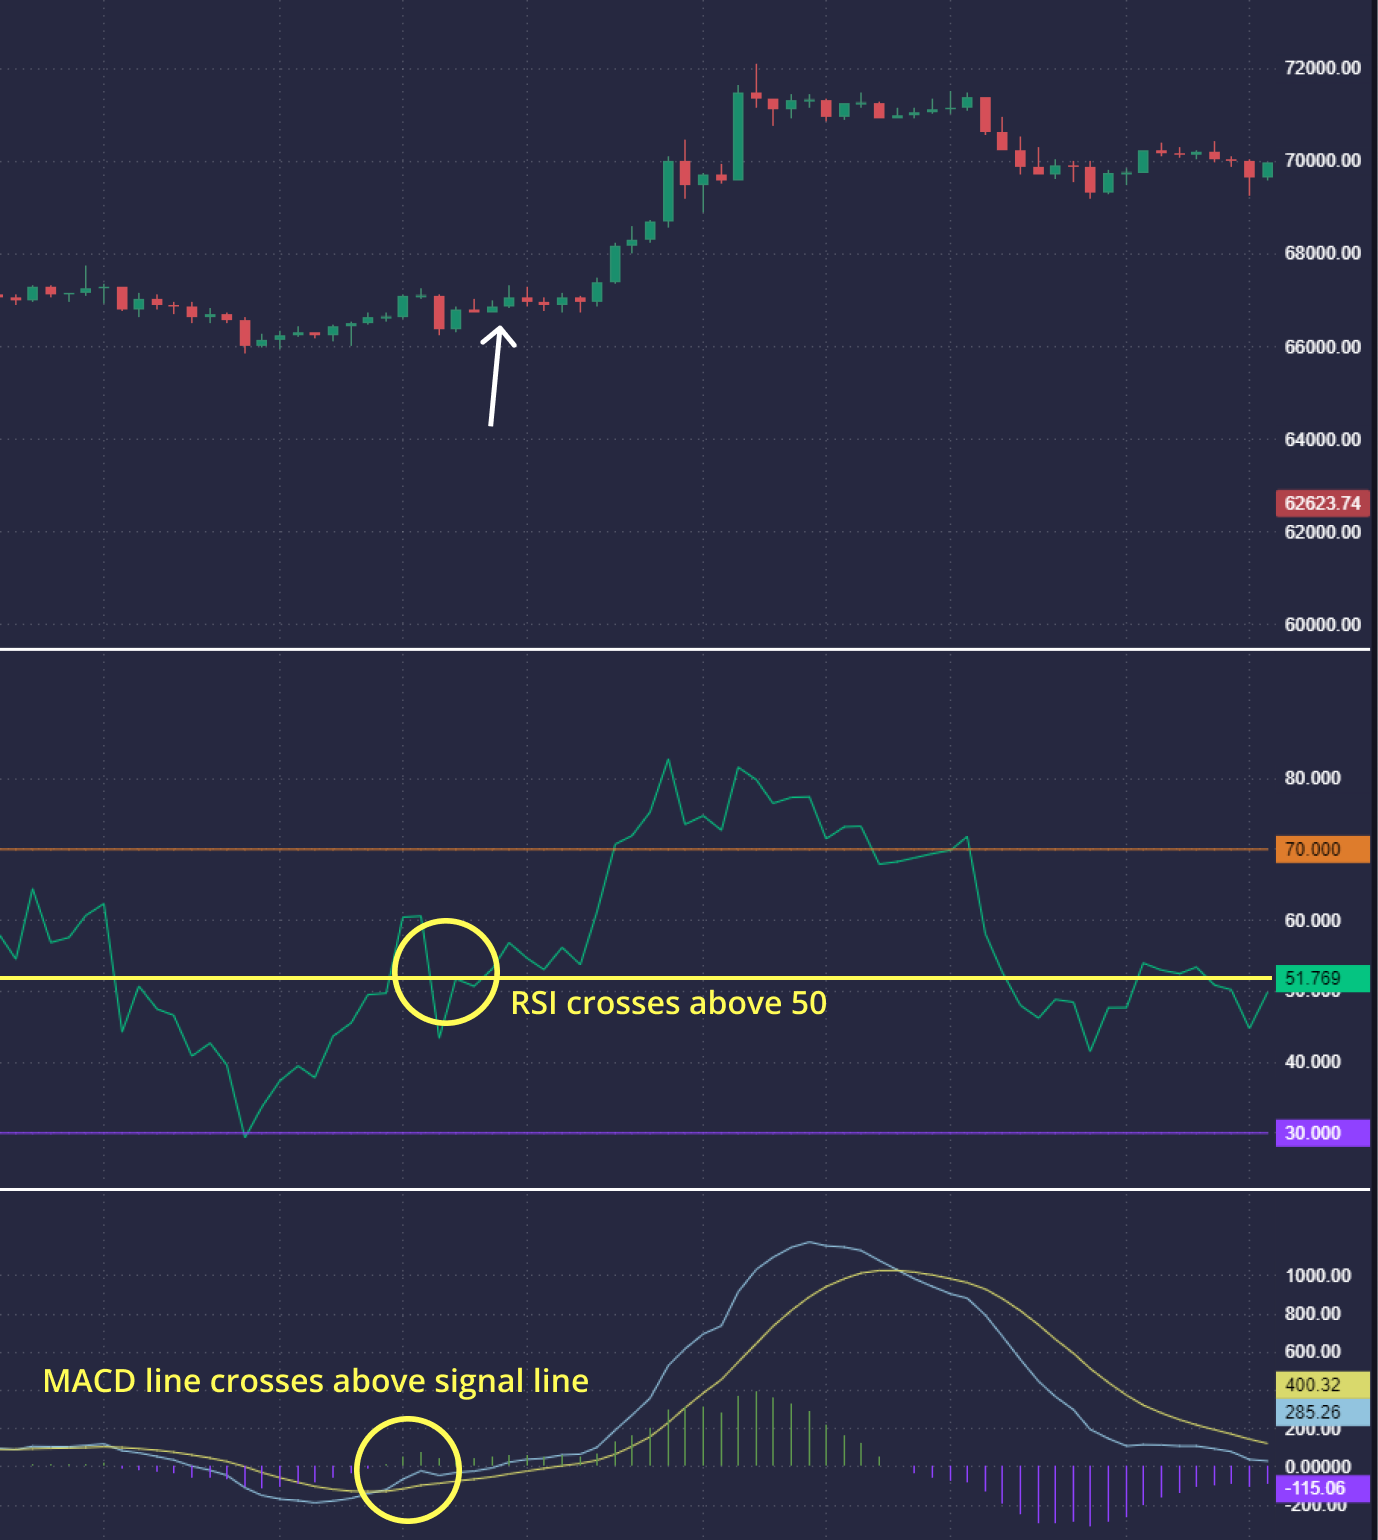
Collaboration with MACD
Combining moving average convergence divergence (MACD) with RSI can enhance understanding of trend shifts and changes in momentum. If, for example, the RSI is showing a bullish divergence (with price pointing to lower lows and the RSI to higher ones) while the MACD line is above the signal line (indicating a bullish crossover), this double signal could indicate an upcoming reversal uptrend.


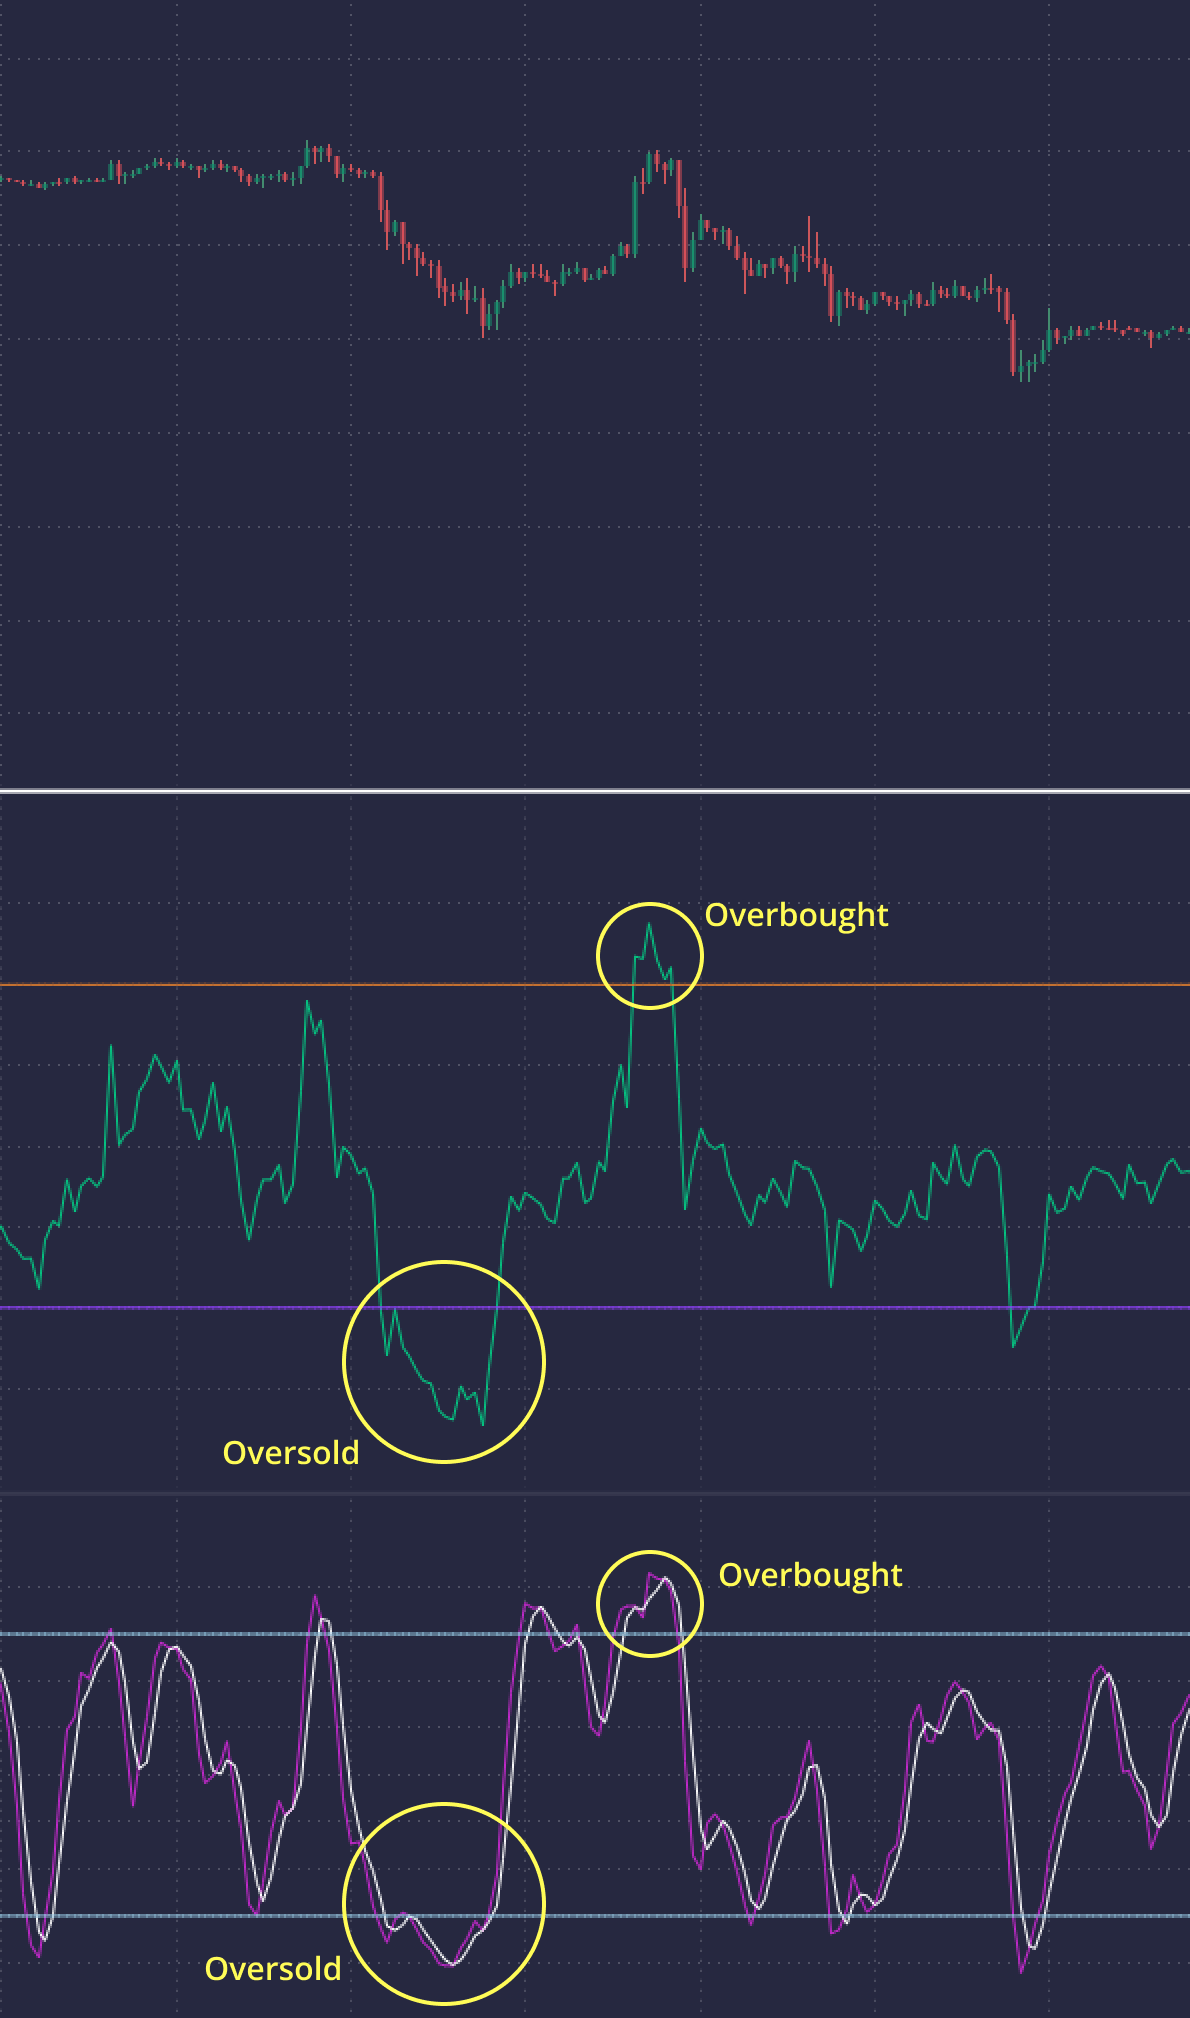
Merging with the stochastic oscillator
Comparing the Stochastic Oscillator and RSI, which measure market dynamics, can help to confirm overbought or oversold conditions. When both indicators simultaneously move from oversold to overbought, this can confirm the forecast for rising prices.

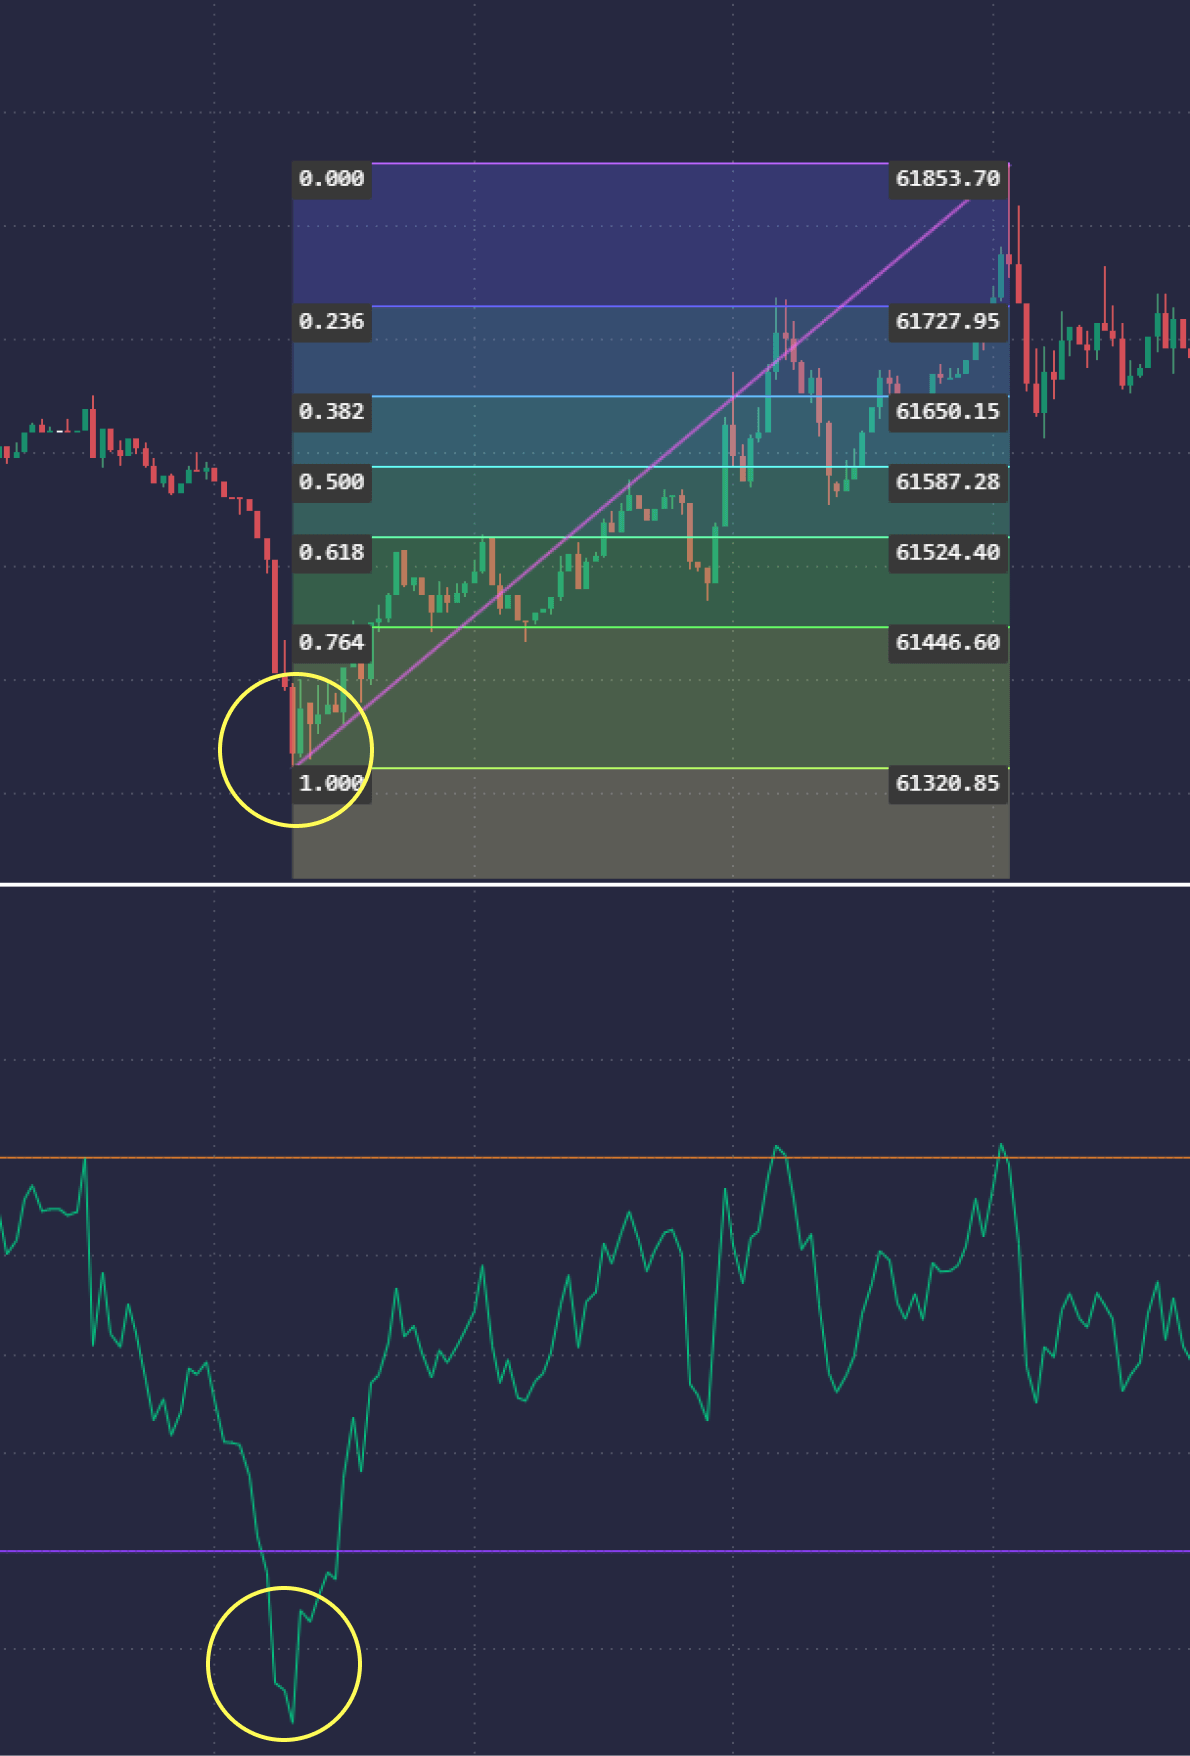
COMBINATION WITH FIBONACCI RETRACEMENTS
Using Fibonacci retracements in combination with RSI allows traders to identify potential support and resistance levels during price pullbacks. A flattening RSI reaching an oversold level near a key Fibonacci retracement level could indicate a significant chance of a price rebound, which is a strategic point to enter long positions.
Removing RSI Limitations
Despite its usefulness, the RSI is not without its problems, including its tendency to produce false signals. As a leading indicator, the RSI is designed to predict entry points ahead of market movements, but such indicators can sometimes be misleading since not all changes in momentum result in a change in price direction. Additionally, while the RSI can signal potential market reversals, it does not provide insight into the magnitude of the upcoming price movement, whether it be a minor correction or a major trend reversal.
Сonclusion
In conclusion, the relative strength index (RSI) is a widely used technical analysis tool that is critical to assessing price movements across a wide range of financial assets. According to Wells Wilder Jr., this indicator is excellent for identifying situations where assets may be overbought or oversold, and also signals potential changes in market trends, thereby offering the trading community irreplaceable information.
The RSI’s adaptability to different timeframes and periods adds to its appeal, as the default configuration is set to 14 periods. However, traders can change these settings to suit their trading style; day traders, for example, can choose a shorter waiting period, such as 7 or 10 days, to increase the indicator’s sensitivity to immediate price movements.
Key strategies using RSI include pinpointing overbought and oversold conditions, performing 50-level crossovers, identifying divergence patterns, and recognizing dips. To further enhance their market analysis and speed up their decision-making process, traders often combine RSI with other key indicators, including moving averages, Bollinger Bands, MACD, Stochastic Oscillator and Fibonacci retracements.
Despite its significant benefits, the RSI is not without problems, including the risk of false signals and the inability to predict the extent of price corrections. However, despite these limitations, the RSI maintains its reputation as an invaluable asset for traders seeking to understand the intricacies of financial markets with greater accuracy.
FAQ
An RSI reading above 70 usually indicates that the asset may be overbought, maybe overvalued at its current level and could face a potential pullback.
Although RSI can signal potential price reversals by identifying overbought and oversold conditions, its forecasting accuracy is not reliable. Traders often use it in combination with other indicators and analysis methods to test signals.
RSI divergence strategies involve looking for discrepancies between the RSI trend and price action. For example, if the price of an asset makes a new high and the RSI makes a lower high, this could indicate weakening momentum, signaling a possible reversal.
RSI dips are patterns that signal a possible trend reversal without the price necessarily reaching overbought or oversold levels. On a bad swing, the RSI breaks above or below key levels (such as 70 or 30), then retests those levels without crossing them, indicating a potential trend reversal.
There is no universal RSI setting that is suitable for all markets or trading strategies. While the default value is 14 periods, traders can adjust it depending on the asset being traded, market volatility and their individual trading style, aiming to optimize the balance between sensitivity to market movements and avoidance of false signals.