McGinley Dynamic Indicator
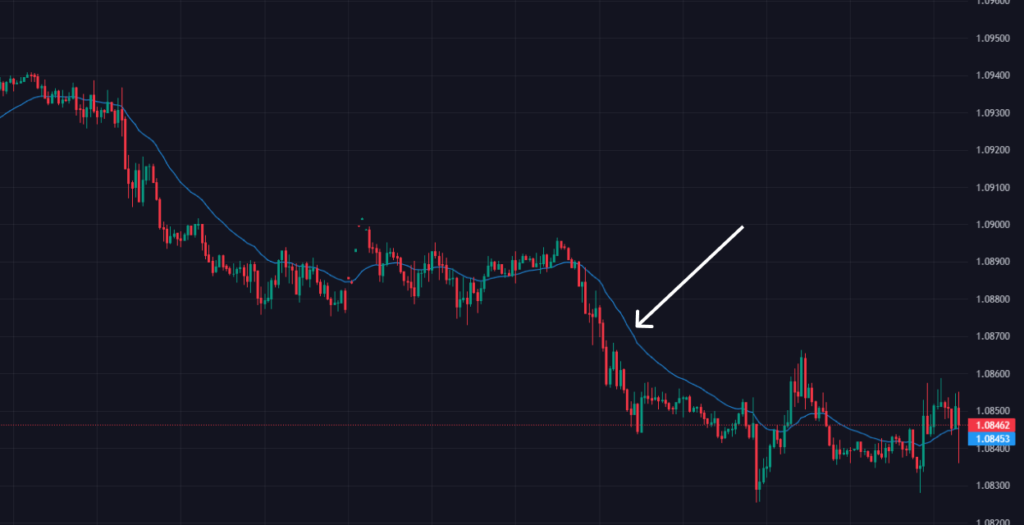
The McGinley Dynamic Indicator emerges as a groundbreaking tool in technical analysis, devised by John R. McGinley in 1990 to combat the inherent lag present in traditional moving averages (MAs) and other indicators. Diverging from its predecessors, this dynamic moving average adapts to market velocity, sculpting a more seamless trend line that smoothens out price disparities. Widely embraced by traders, it serves as a potent instrument for uncovering market trends and potential signals.
Key Insights
4. Constraints and Considerations.
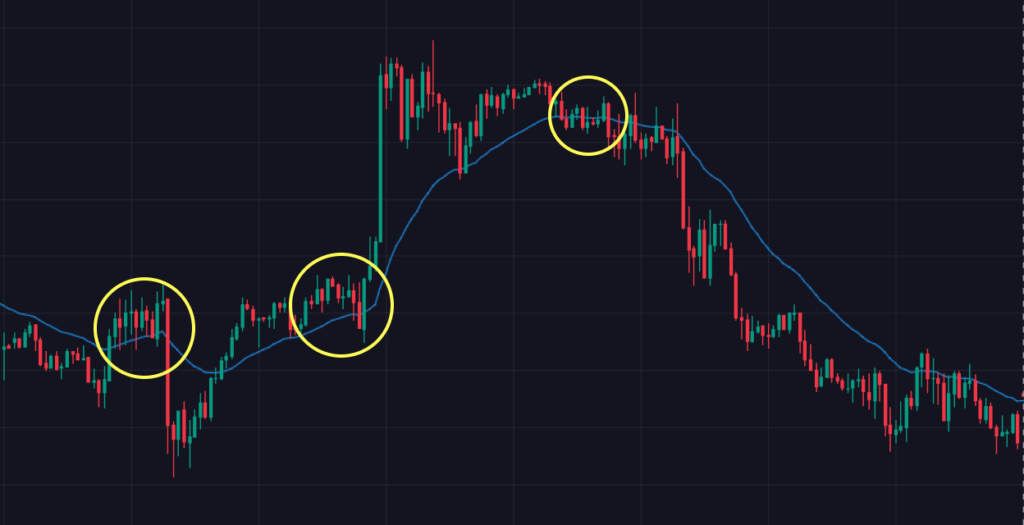
Despite its merits, McGinley’s dynamic is not devoid of limitations. Traders must exercise caution regarding potential false signals, particularly in range-bound markets. Furthermore, its availability on trading platforms may be restricted, necessitating alternative approaches for some traders.
Understanding the Formula
The McGinley Dynamic Indicator formula hinges on its ability to adapt to market pace. As a variant of the moving average, its adjustment factor varies with price volatility, ensuring its relevance amid volatile market conditions. The formula is represented as follows:
MD = MD1 + (Price – MD1) / N * (Price/MD1) 4)
Where:
MD1 – signifies the previous value of the McGinley Dynamic Indicator.
Price – denotes the most recent price in the data series.
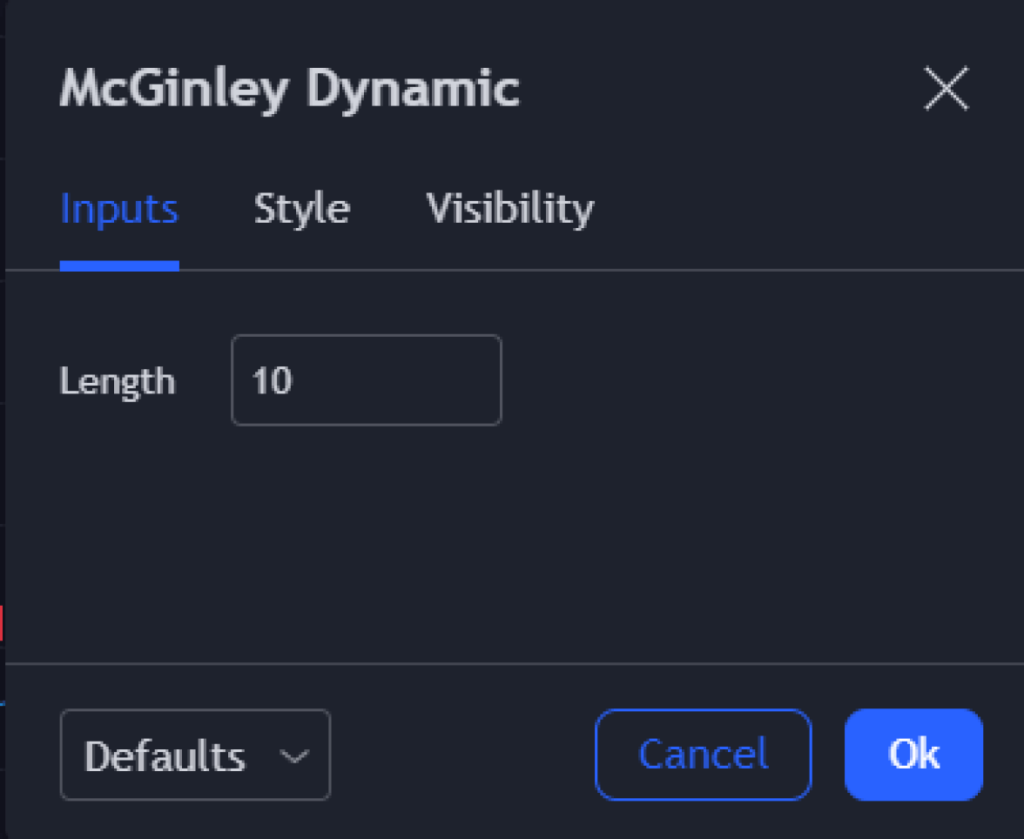
N – represents the smoothing factor, typically defaulted to 10 but adjustable based on trading strategies.
(Price/MD1) 4 – acts as an adaptive coefficient, aligning with the pace of price changes.
The McGinley Dynamic indicator necessitates period settings, such as 10 for short-term strategies, and elongated periods like 14, 20, or 30 for long-term trading or volatile markets. Adaptability is paramount as no singular setting fits all scenarios, underscoring the importance of tailoring settings to individual trading objectives and market conditions.


Some Advanced Strategies for Maximizing the McGinley Dynamic Indicator's Potential
Expanding upon the potential of the McGinley Dynamic Indicator involves delving into advanced strategies that marry it with complementary tools, amplifying its effectiveness in guiding trading decisions. By intertwining this indicator with a spectrum of technical analysis tools, traders can augment its predictive capacity and refine their market insights to a heightened level of sophistication.
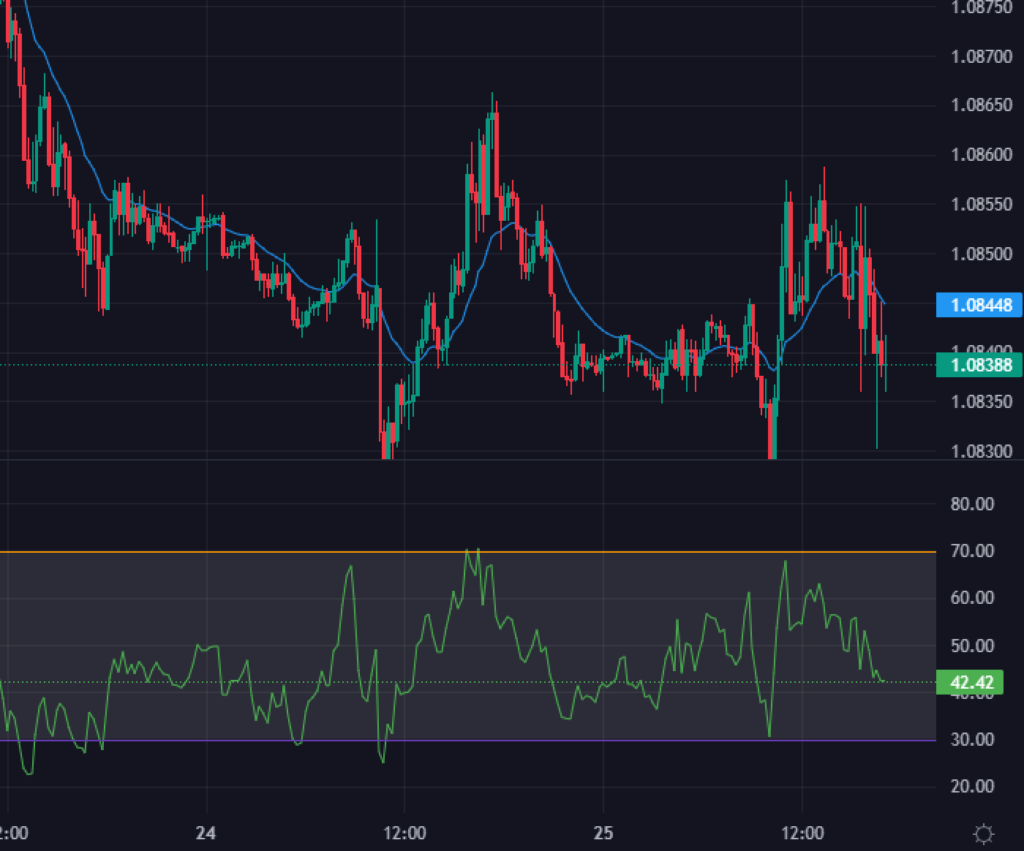
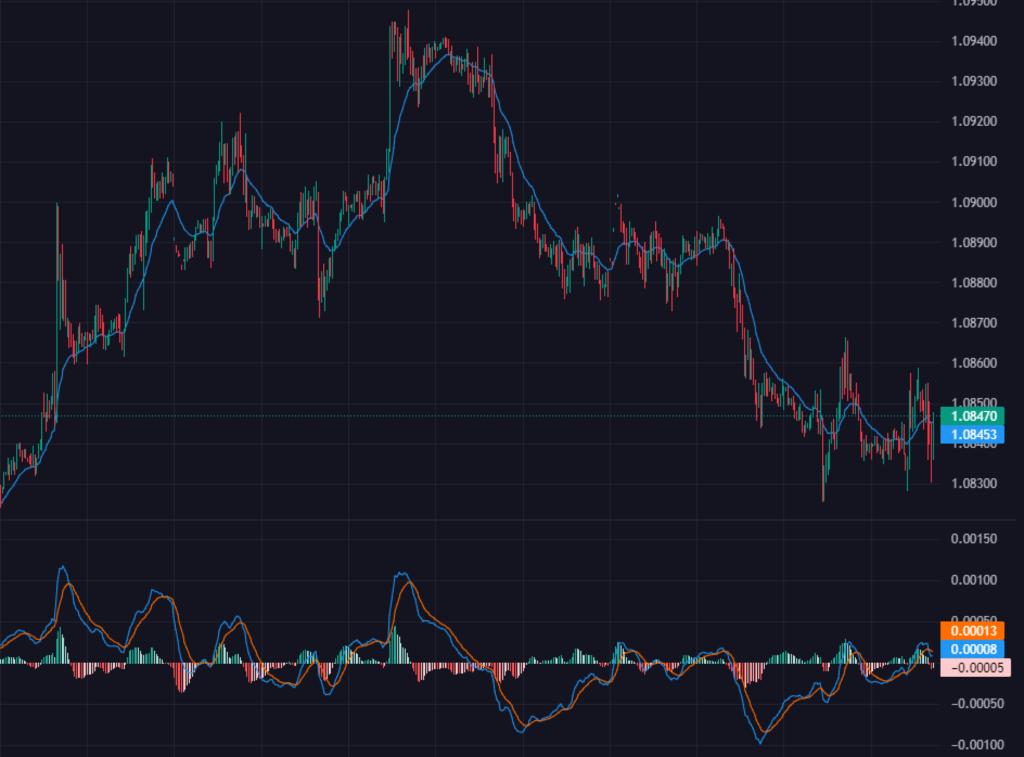
One sophisticated approach entails coupling the McGinley Dynamic Indicator with synergistic indicators like the Relative Strength Index (RSI) or the Moving Average Convergence Divergence (MACD). This symbiotic integration allows traders to harness a panoramic perspective of market dynamics, facilitating the validation of signals and the mitigation of false positives with heightened precision.
Moreover, an alternative tactic is to integrate the principles of price action analysis alongside the McGinley Dynamic Indicator. This involves scrutinizing candlestick patterns and chart formations to discern potential market trajectories. When employed in conjunction with the McGinley Dynamic Indicator, traders can corroborate its signals with price action cues, fortifying the reliability of their trading judgments with a nuanced understanding of market sentiment and behavior.


FAQ
The McGinley Dynamic indicator sets itself apart with its adaptability, which reduces latency compared to standard moving averages. Its innovative formula ensures more accurate tracking of price movements by smoothing out market noise, resulting in clearer signals. Essentially, the McGinley indicator offers a unique method of monitoring price movements while minimizing lag in comparison to traditional moving averages.
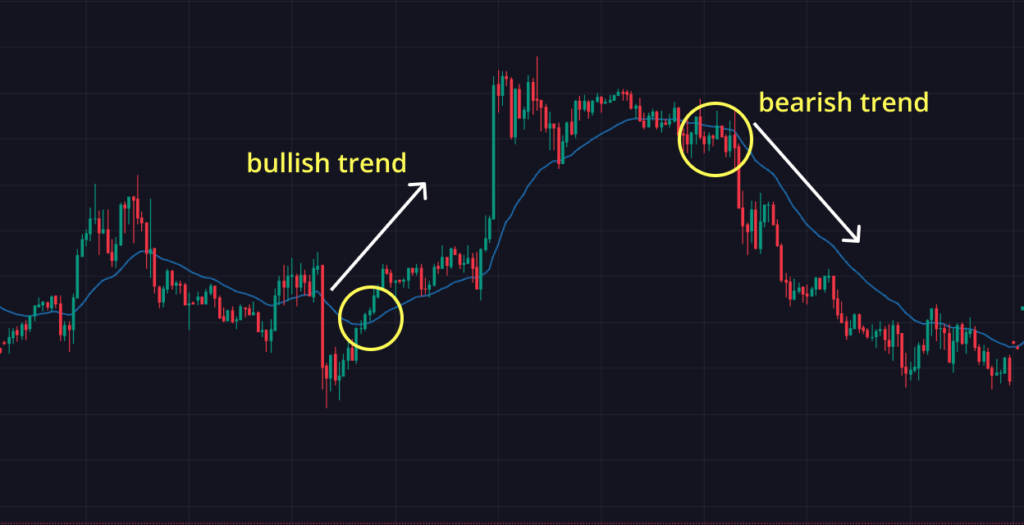
Trading signals generated by the McGinley Dynamic indicator adhere to conventional interpretations of moving averages. A rising indicator crossing below the price line suggests a potential bullish trend, while a falling indicator crossing above the price line indicates a potential bearish trend.
McGinley Dynamics offers the advantage of swift response to price changes, aiding traders in navigating volatile markets with fewer false trades. Its adaptability and versatility across various markets and timeframes make it a valuable asset for many traders and investors.
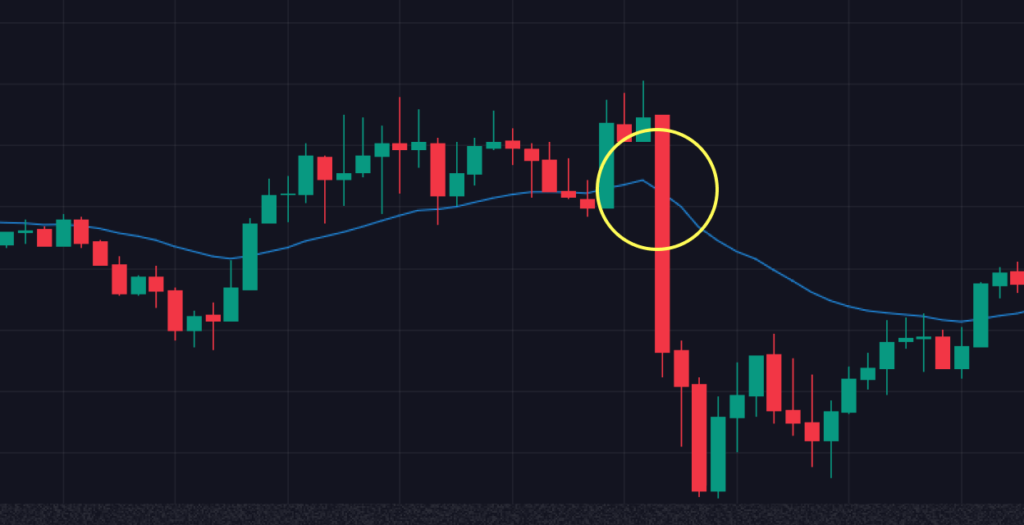
Traders should be cautious of potential limitations when employing the McGinley Dynamic Indicator. These include the risk of false signals, particularly in volatile markets, and its subpar performance in range-bound conditions. Additionally, its availability on trading platforms may be limited, necessitating the integration of supplementary analytical methods for comprehensive market assessment.
