Trading with technical analysis can be significantly enhanced by using indicators like the Mass Index. This indicator has gained acclaim for its ability to forecast reversals in trends and offer valuable insights into market dynamics.
What is the Mass Index?
The Mass Index, a trend reversal indicator, was developed by technical analyst Donald Dorsey and first introduced in 1992. Unlike many traditional indicators that rely on relative strength, volume, or moving averages, the Mass Index focuses on fluctuations in price ranges. Its primary goal is to detect expansions and contractions in price ranges that may indicate imminent changes in trading direction. This distinctive approach enables traders to anticipate potential reversals by observing patterns of bulging and contracting, providing additional decision-making tools in times of heightened uncertainty.
How does the Mass Index function?
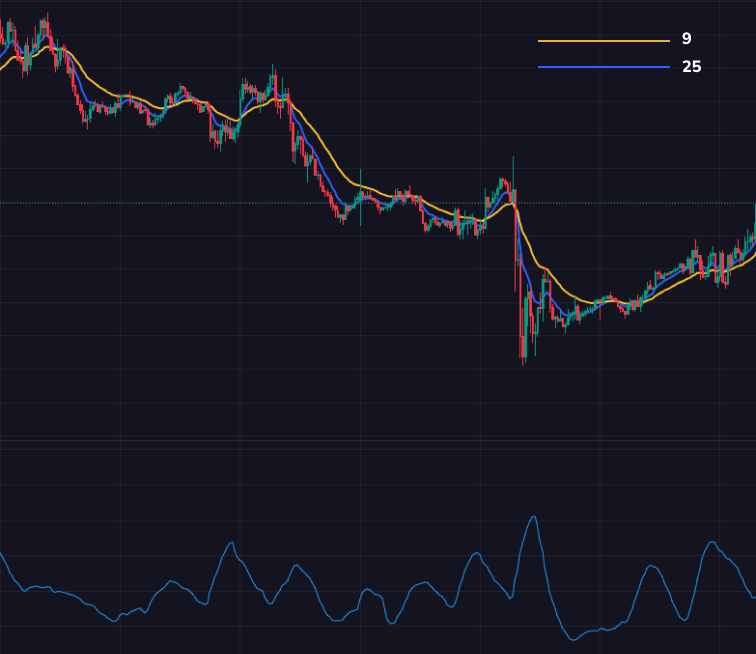
The core principle of the Mass Index involves measuring the relationship between the 9-day and 25-day exponential moving averages (EMA) of a price range.
The Mass Index operates through the following stages:
1. Calculation of the daily price range, which is the difference between the high and low prices of each trading day.
2. Construction of two exponential moving averages (EMA) based on this price range: one with a 9-day period and another with a 25-day period.
3. Derivation of the Mass Index from the ratio of the 9-day EMA to the 25-day EMA of the price range. This ratio serves to identify periods of market expansion or contraction.
When the Mass Index surpasses a critical threshold, typically set around 27, it indicates a potential trend or trend reversal. Such an overshoot suggests that the price range has expanded significantly, often signaling an impending change in the current market direction.
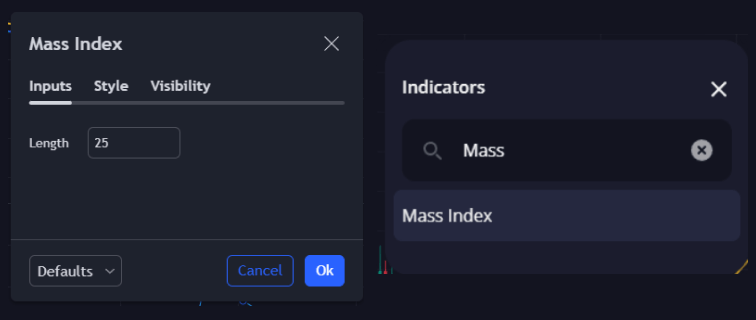
Connection and Basic Setup of the Indicator
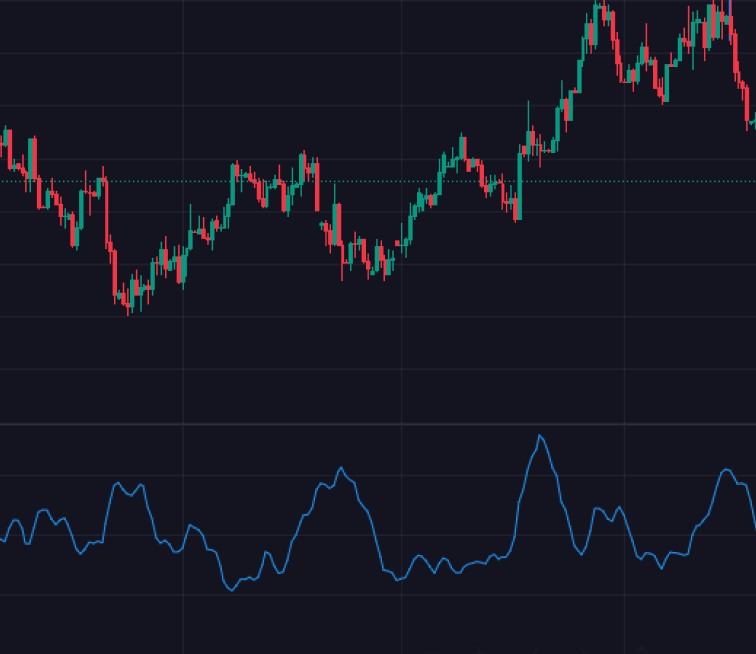
The Mass Index indicator is typically added to the bottom of a price chart as an auxiliary tool or can be overlaid directly on the price movement chart. Unlike oscillators whose values range between -1 and 1, the Mass Index values typically range from +8 to +12.
Also, the Mass Index is commonly placed at the bottom of the price chart as a supplementary tool. Some trading platforms allow it to be overlaid directly onto the price chart for convenience.
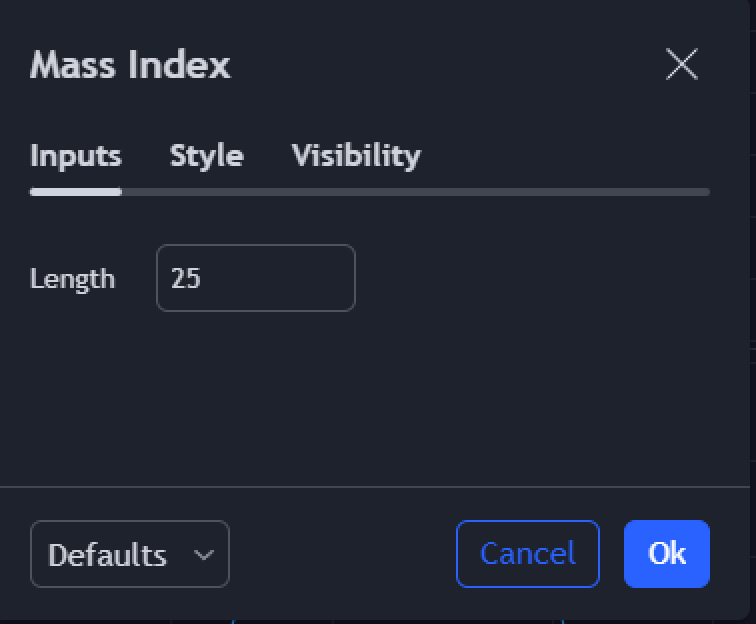
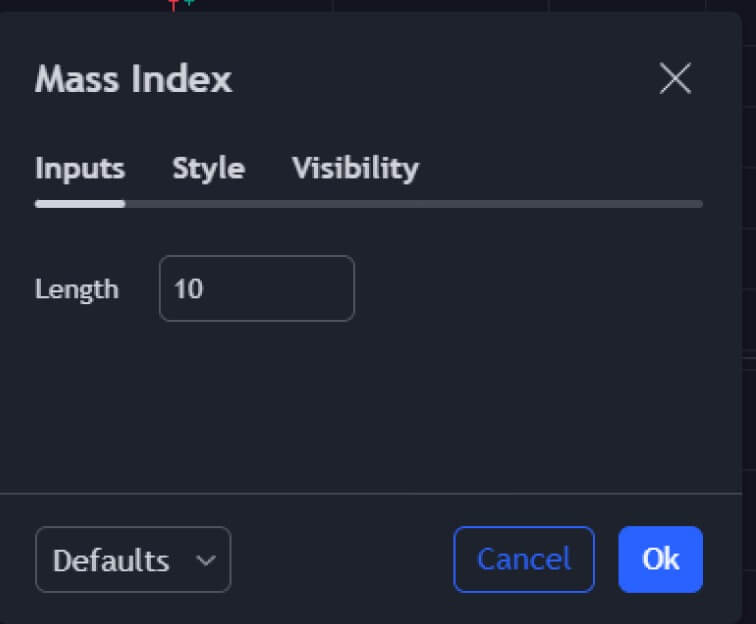
Traders must choose a time period for the indicator. The standard period is 25 days, but this can be adjusted based on trader preferences and strategies. For faster responsiveness to market changes, a shorter period like 10 days can be selected.
Basic Indicator Settings
1. Setting the Time Period:
Begin by selecting the time period for the indicator. While 25 periods are commonly used, choosing 10 periods allows for quicker analysis.
2. Calculation of Price Range:
Calculate the difference between the highest and lowest prices for each bar or candle within the chosen time frame (e.g., 25 days). For instance, calculate the difference for the first day, then repeat this for each subsequent day up to the 25th day.
3. Calculation of 9-Day Exponential Moving Average (EMA):
Compute the 9-day EMA of the price range (i.e., the difference between high and low prices) over the selected period.
4. Calculation of Mass Index:
Determine the Mass Index value by dividing the 9-day EMA of the price range by the 25-day EMA of the price range.
Interpretation and Practical Application of the Mass Index
The Mass Index typically ranges between +8 and +12, distinguishing it from oscillators that are confined within -1 to +1. A sharp rise in the indicator line, surpassing the critical threshold of 27, suggests a potential trend change. However, the Mass Index alone does not indicate the direction of this change. Traders need to employ additional indicators and analysis methods to determine the direction of the emerging trend.
Donald Dorsey identified the key signal in range swing analysis as the “bulge” indicating an imminent reversal. This occurs when the average daily range gradually expands, signaling increasing market volatility and a potential reversal. As volatility peaks, it tends to retract, signaling a slowdown and potential reversal in momentum. The strategy aims to enter trades ahead of momentum shifts in new directions.
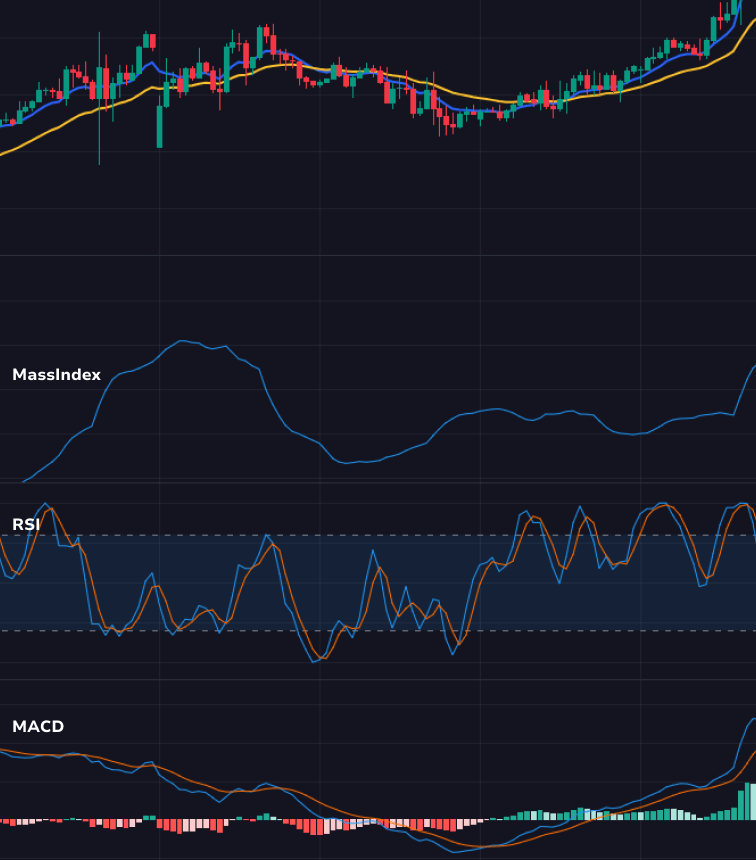
Originally designed for daily charts, the Mass Index is equally applicable on intraday charts such as hourly time frames. Since it does not offer clear directional signals, it is advisable to use it alongside indicators like RSI, MACD, or candlestick patterns to confirm signals. Traders can adjust the indicator’s time periods to suit their trading strategies, adapting to market volatility and desired sensitivity levels.
Despite its simplicity and effectiveness, the Mass Index is not a standalone tool. It should be complemented with other indicators and analytical methods to validate signals and mitigate false positives. While potent for predicting market reversals, achieving optimal results with the Mass Index requires careful calibration and integration with broader analytical approaches.
Example of a Strategy with the Mass Index Indicator
There are numerous trading strategies that can incorporate the Mass Index (MI) indicator, particularly when combined with other technical indicators that help identify trends. Below is one approach to utilizing the Mass Index indicator strategy.
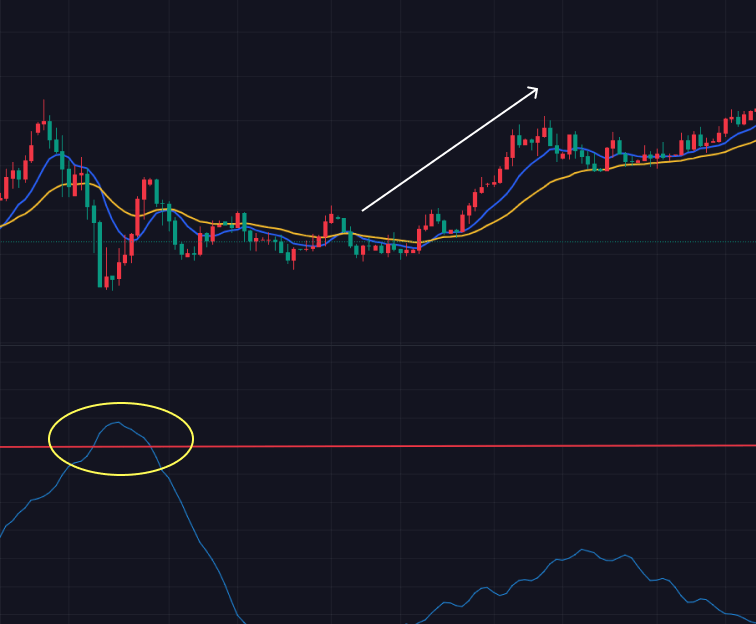
This trading system employs a “reversal convexity” approach, defined by the Mass Index (set to 25 periods) rising above 27 and then dropping below 26.5. A convex reversal indicates that a range of highs and lows has peaked and subsequently moved away from the extremes, signaling a potential trend change.
The strategy also integrates a nine-period exponential moving average (EMA), which assists in trend identification. This allows traders to interpret the MI “bulge” as a signal to enter long (buy) positions when the EMA is downward trending or short (sell) positions when the EMA is upward trending.
Step 1:
Add the Mass Index indicator set to 25 periods.
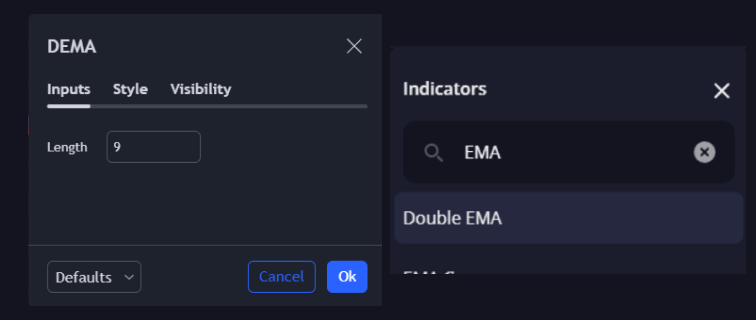
Step 2:
Include the nine-day EMA on your chart.
Step 3:
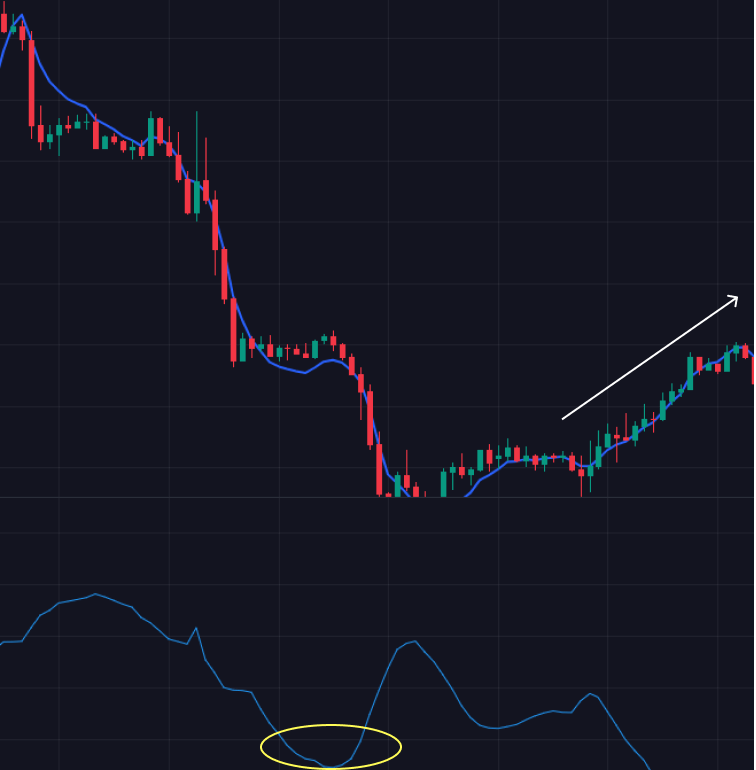
If the EMA slopes downward, consider entering a long position at the “reversal convexity.”
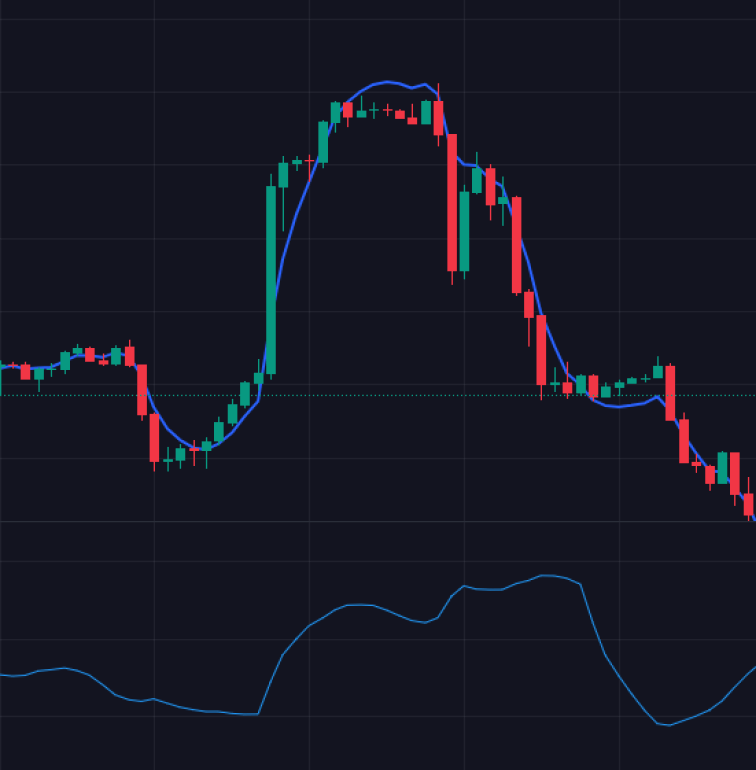
Step 4:
If the EMA slopes upward, consider entering a short position at the “reversal convexity.”
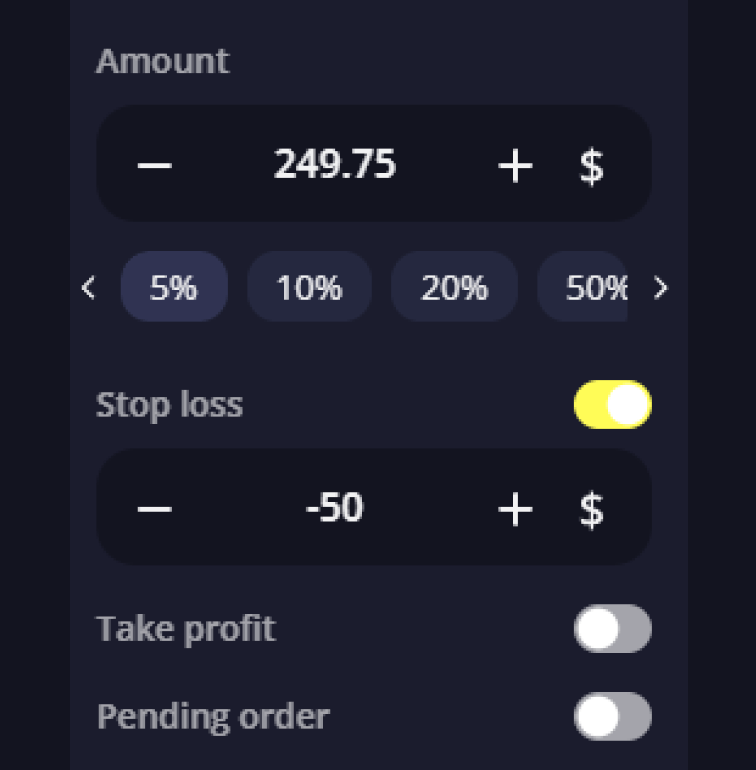
Step 5:
Implement your preferred risk management strategies, including setting stop losses.
Adjustments to this strategy might involve varying the Mass Index settings (e.g., using a lower period like 10 instead of 25) or altering the EMA parameters (e.g., using a five-period EMA instead of nine).
This example illustrates one potential approach to trading with the indicator. It should not replace thorough research and analysis. Always conduct your due diligence before trading, employ effective risk management strategies, and refrain from trading with funds you cannot afford to lose.
The Mass Index Benefits for Traders
Traders utilize the Mass Index as a graphical representation depicting typical price bar behaviors preceding a price reversal. This indicator incorporates a mathematical formula to interpret fluctuations in the range between market highs and lows over a specified timeframe.
Market behavior often follows a pattern where the average daily range (ADR) oscillates from narrow to wide and back to narrow. This cyclic pattern mirrors concepts observed in Bollinger Bands, which contract when prices are stable and expand during periods of volatility.
The Mass Index proves most beneficial in volatile market conditions characterized by swift price movements, where traditional analytical methods may falter. It offers traders a distinctive tool for analyzing market dynamics, emphasizing the need for meticulous and strategic application to yield optimal outcomes.
A notable advantage of the Mass Index is its market neutrality, allowing it to detect “reversal bulges” irrespective of whether the market is in a trading range or experiencing high momentum trends. This stands in contrast to indicators like overbought/oversold oscillators, which lose effectiveness in trending markets, or trend indicators like moving averages, which are less informative during sideways price action.
Limitations of the Mass Index Indicator
One of the primary limitations of the Mass Index indicator is its inability to determine the direction or trend of a market reversal. This is why strategies incorporating the Mass Index often integrate moving averages to ascertain the prevailing trend.
Another recognized constraint is its nature as a leading indicator. This implies that a signal for a market reversal emerges before the actual reversal occurs. Traders typically manage this limitation by adjusting stop losses to accommodate potential reversals or by employing supplementary tools like candlestick patterns or lagging indicators such as moving averages to validate the reversal signal.
Despite these limitations, the Mass Index remains a crucial component of technical analysis, offering potential enhancements in forecast accuracy and trading decision effectiveness. A thorough grasp and proficient application of this indicator can serve as a pivotal factor in achieving success and significant financial gains in today’s dynamic markets.