The Ichimoku Cloud: An In-Depth Guide

Dive deep into the intricate world of the Ichimoku Cloud, a formidable ally in the arsenal of technical analysis, offering traders profound insights into the ebb and flow of market dynamics and the elusive art of trend identification. This exhaustive compendium aims to demystify the complexities of the Ichimoku Cloud, equipping traders with the knowledge to wield it adeptly within their trading strategies.

At its core, the Ichimoku Cloud serves as a beacon, illuminating trend directions, heralding momentum shifts, and delineating the battleground of support and resistance. While it refrains from crystal ball gazing into the future of price movements, it bestows upon traders a treasure trove of real-time and historical market data, a compass amidst the tempestuous seas of financial markets. When harmonized with complementary technical indicators, the Ichimoku Cloud metamorphoses into a potent instrument, enhancing the precision of trading maneuvers.

Conceived by the visionary Japanese journalist, Goichi Hosoda, during the tumultuous 1930s and unveiled to the public in the seminal year of 1969, the Ichimoku Cloud is an intricate tapestry woven from multiple threads, each thread weaving a distinct facet of market dynamics. The five lines and the ethereal shaded expanse together form the backbone of this enigmatic indicator, offering a panoramic vista of price action over a defined temporal horizon. A glimpse above the cloud heralds an ascent, while a descent beneath foretells a downtrend, and ensconced within portends a period of consolidation.

Navigating the labyrinth of the Ichimoku Cloud necessitates an intimate acquaintance with its constituent components, each bearing its own significance in the grand mosaic of trading strategies.

The main components of the Ichimoku Cloud

1. The Ichimoku Cloud Indicator

An amalgamation of disparate elements, proffering traders a kaleidoscopic view of market conditions, a compass in the tempest.

2. Tenkan-Sen (Conversion Line)

Forged from the crucible of nine periods, this line charts the course of short-term momentum, unveiling the contours of potential support and resistance. A bullish omen materializes as the Tenkan-Sen ascends above the Kijun-Sen, while a bearish portent looms with its descent.

3. Kijun-Sen (Baseline)

Extending its gaze over 26 periods, this line casts light on the medium-term trajectory, delineating the contours of trend and the bastions of support and resistance. A surge above heralds bullish tides, while a plunge below signals a bearish descent.

4. Senkou Span A

A synthesis of Tenkan-Sen and Kijun-Sen, projected into the future by 26 periods, this ethereal band adumbrates medium-term trends and the thresholds of support and resistance. Ascension above augurs bullish vistas, while descent forewarns of bearish tempests.

5. Senkou Span B

A cornerstone component within the Ichimoku Cloud, plays a pivotal role in unraveling the intricate tapestry of market dynamics. Derived from the amalgamation of the highest high and lowest low over the preceding 52 periods, and projected forward by 26 periods, it emerges as a stalwart sentinel, illuminating the path of medium-term trends and fortifying the bastions of support and resistance. The ascendancy of prices above the Senkou Span B level heralds a bullish narrative in the market, while a descent below signifies the solemn proclamation of a bearish trajectory.

6. Chikou Span

Completing the ensemble, the Chikou Span indicator assumes its rightful place, positioned 26 periods adrift from the present price. This quintessential component serves as the harbinger of trends, the custodian of support/resistance levels, and the herald of trading signals. A bullish proclamation echoes through the annals of the market as the span surpasses the price, while a somber dirge resounds when it descends below.

Harnessing the Power of the Ichimoku Cloud

Owning this powerful tool is the key to increase your trading acumen and to achieve success. Strategic deployment using the Ichimoku Cloud and decoding important signals:

1. Bullish and Bearish Portents. 

The celestial dance of asset prices in relation to the ethereal confines of the Cloud unveils the sentiment prevailing in the market. Ascension above the Cloud heralds bullish fervor, while descent below portends a bearish narrative, guiding the discerning trader’s hand.

2. Confluences of Tenkan-Sen and Kijun-Sen.

The celestial alignment witnessed by the Tenkan-Sen crossing above the Kijun-Sen sings the ode of bullish momentum, while its descent beneath paints a somber portrait of bearish inclination. These junctures offer glimpses into the sanctum of entry and exit.

3. Senkou Span Confluences.

When the halo of Senkou A eclipses that of Senkou B, a bullish melody fills the air, whereas the reverse symphony signals bearish undertones. These intersections unravel vistas of opportunity, illuminating the path to optimal trading positions.

Strategic Maneuvers with the Ichimoku Cloud

Path of Trend Pursuit:

Traders adept in the art of discernment dissect the intricate tapestry of the indicator’s components to unveil the prevailing trends and calibrate their endeavors accordingly. A time-honored tactic involves waiting for omens such as the Tenkan-Sen/Kijun-Sen or Senkou Span A/Senkou Span B crossover before embarking on trades aligned with the current trend. Supplementary indicators, such as oscillators and moving averages, serve as faithful companions, validating the chosen path.

Breakout Symphony:

Identifying the celestial breaches above or below the Cloud augurs the dawn of paradigm shifts or the continuance of established trends. The Chikou Span, ever vigilant, lends its confirmation to these celestial proclamations, facilitating strategic trade entries. The judicious use of stop-loss orders acts as a bulwark against potential losses, although the sanctuary of guaranteed stop losses, devoid of the specter of slippage, may entail ancillary fees.

Reversal Reverie:

Traders with an eye for the mercurial currents of trend reversal heed the whispers of signals such as Chikou Span crossovers or Kumo twists. These heralds of change illumine the path through the labyrinth of market sentiments, guiding traders through the capricious waters of market dynamism.

Maximizing the Utility of the Ichimoku Cloud

Comprehending the Indicator. Mastery of the Ichimoku Cloud and its myriad facets necessitates an intimate understanding of the alchemy behind each calculation and its role in birthing trading signals.

Fusion of Forces.

While the Ichimoku Cloud stands as a stalwart sentinel in its own right, its potency burgeons when intertwined with complementary technical indicators. This symbiosis begets signal validation and a profound comprehension of market ebbs and flows, fostering judicious trading choices.

Charting the Course.

Precision reigns supreme in the realm of trading signals bestowed by the Ichimoku Cloud. Meticulous delineation of entry and exit points augments trade execution, casting asunder the veils of uncertainty.

Fortifying Risk Management.

Prudent stewardship of risk is the cornerstone of trading with the Ichimoku Cloud. The utilization of risk mitigation techniques, such as stop-loss orders, serves as a bulwark against the tempestuous tides of market volatility, albeit tethered to attendant fees that shield against precipitous losses.

FAQ

The Ichimoku Cloud offers a holistic view of market dynamics, encompassing various elements such as trend direction, momentum shifts, and support/resistance levels within a single indicator. Its unique construction allows traders to gauge market sentiment and potential reversals with remarkable precision.

Interpreting Ichimoku Cloud signals requires a thorough understanding of its components and their interactions. Traders need to discern bullish and bearish signals based on the position of prices relative to the Cloud, as well as identify key intersections such as Tenkan-Sen/Kijun-Sen crossovers and Senkou Span confluences to pinpoint optimal entry and exit points.

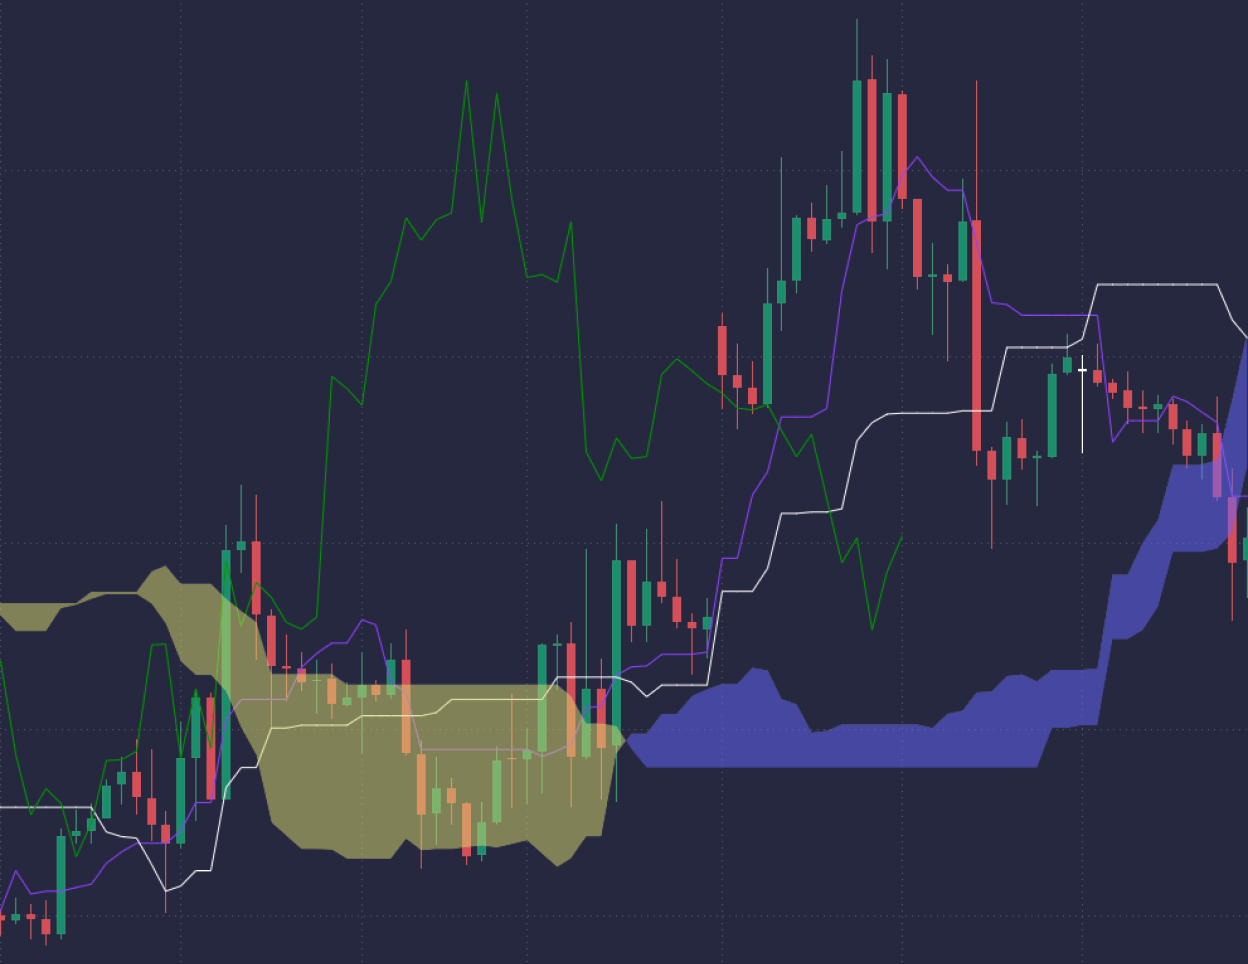
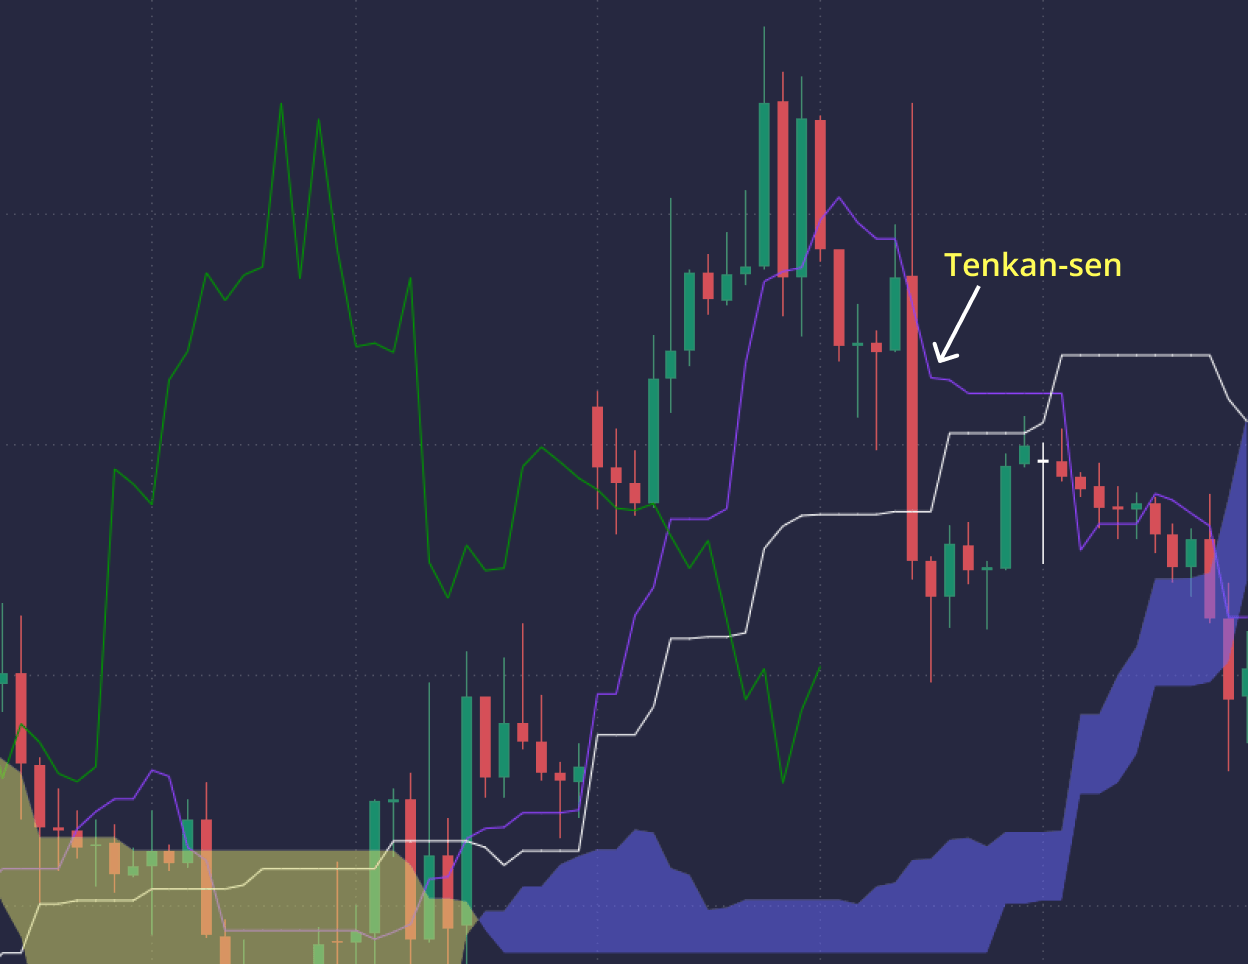
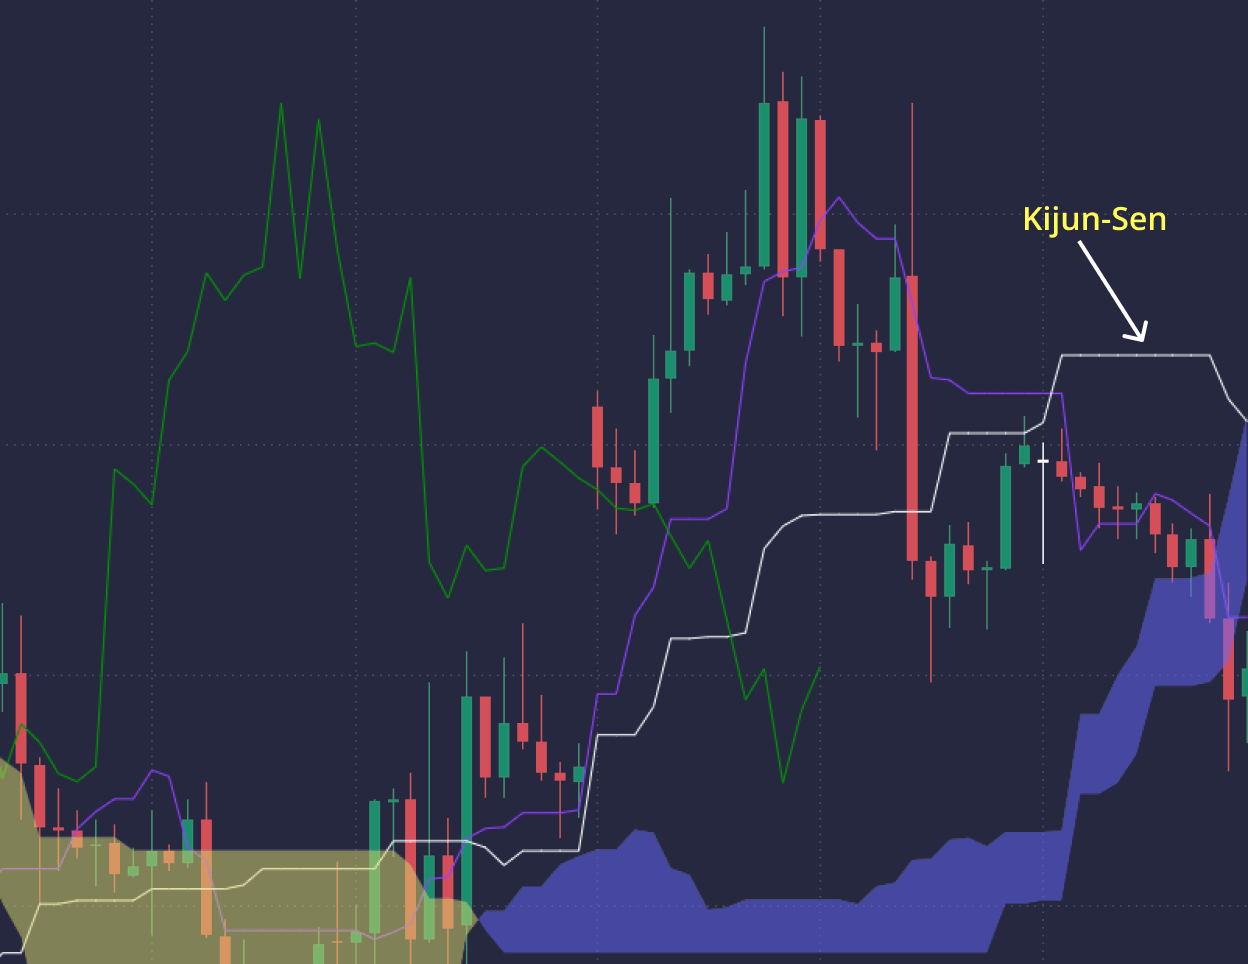
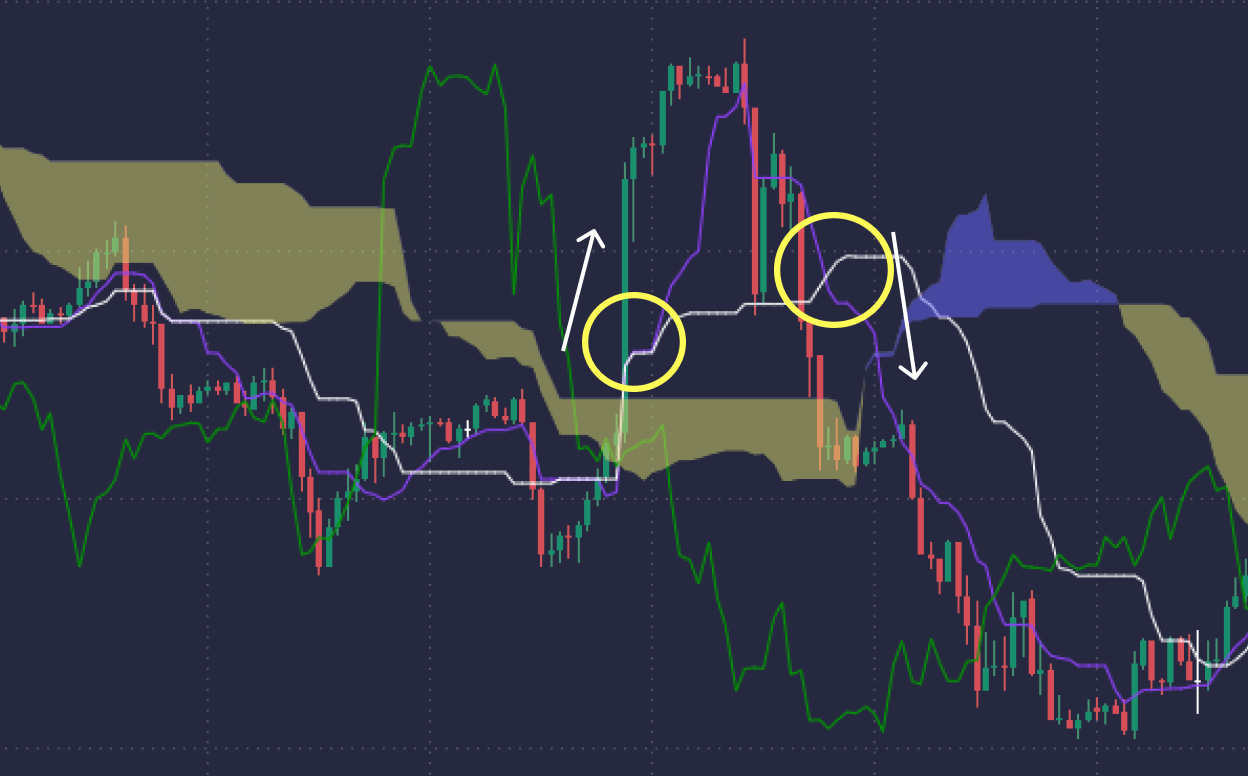
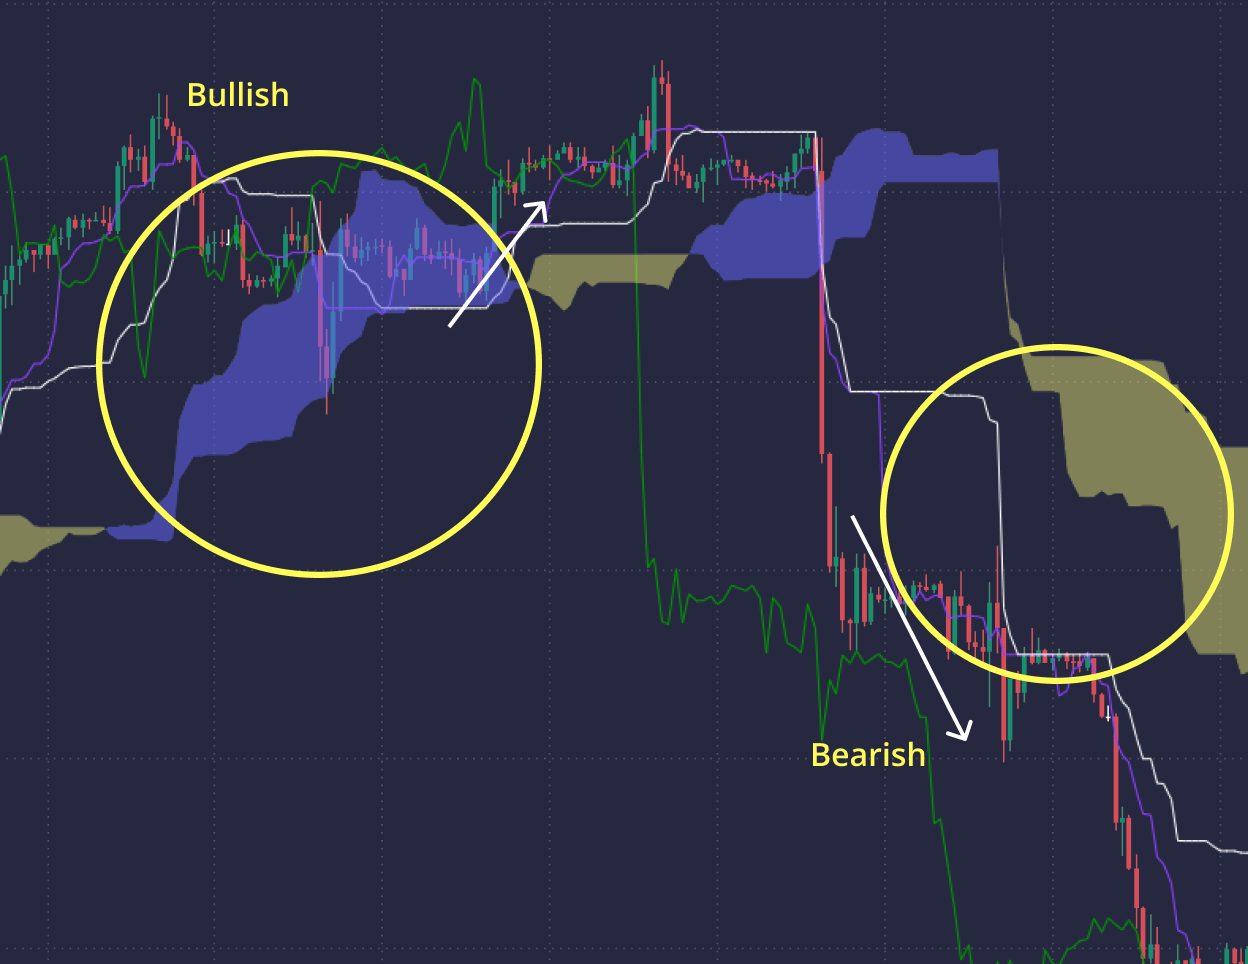
Yes, the versatility of the Ichimoku Cloud makes it adaptable to various trading strategies. Whether you’re a trend follower, breakout trader, or reversal specialist, the Ichimoku Cloud provides valuable insights and signals to support your preferred approach. However, it’s essential to tailor your strategy and risk management techniques to align with the specific signals and conditions identified by the Ichimoku Cloud.

Integrating the Ichimoku Cloud with complementary technical indicators can enhance its effectiveness and provide additional confirmation signals. Traders can combine it with moving averages, oscillators, or other trend-following tools to validate signals and gain a deeper understanding of market trends. Experimentation and backtesting are crucial to finding the optimal combination of indicators that align with your trading style and objectives.